
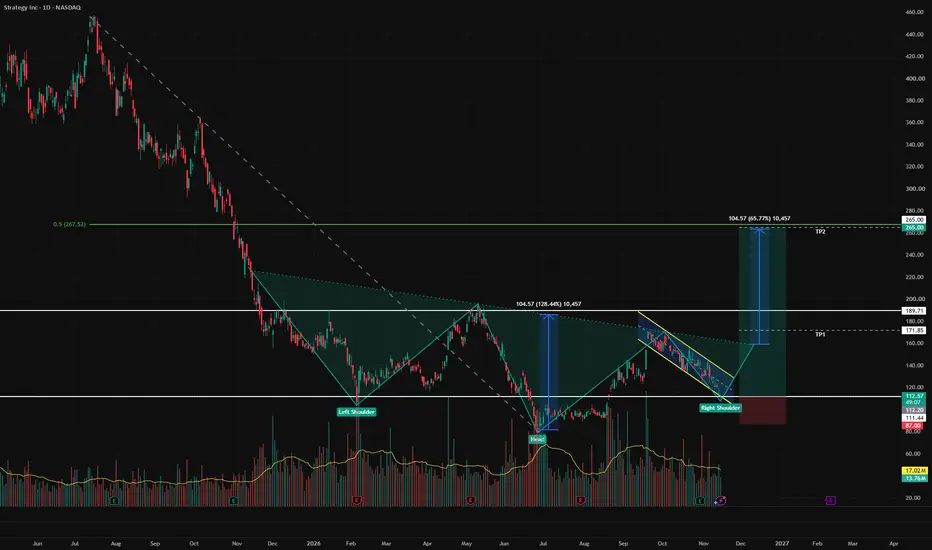
Strategy Inc. (formerly MicroStrategy) is sitting at a key support level on the daily chart, where two patterns are converging: a falling parallel channel that has pulled price back to its lower line, and what looks like the right shoulder of a large inverse head and shoulders. Today’s hammer candle at support hints that buyers are stepping in. On top of that, Bitcoin, the main driver of MSTR’s price, looks to be carving out a higher low after its June 2026 cycle bottom. This idea covers the backdrop, the technical structure, and a trade plan with two targets.
━━━━━━━━━━━━━━━━━━━━
1) BACKDROP: WHY MSTR FOLLOWS BTC
━━━━━━━━━━━━━━━━━━━━
→ A Bitcoin proxy: Strategy’s balance sheet is built around its Bitcoin treasury, so the stock moves with BTC, and usually with more amplitude in both directions.
→ BTC higher low in progress: Bitcoin appears to be forming a higher low after the cycle bottom it made in June 2026. If that higher low holds, it provides the backdrop for MSTR to complete its right shoulder and turn higher.
→ MSTR is moving early: MSTR’s own reversal structure is taking shape ahead of a confirmed BTC trend change. If Bitcoin confirms, MSTR is already positioned for the move.
━━━━━━━━━━━━━━━━━━━━
2) TECHNICAL ANALYSIS (DAILY TIMEFRAME)
━━━━━━━━━━━━━━━━━━━━
→ Inverse head and shoulders
Left shoulder (early February 2026, about 105): the first capitulation low after the late-2025 selloff.
Head (late June 2026, about 80): the cycle low, set on the heaviest volume on the chart, which is a classic washout.
Right shoulder (forming now, about 108–112): a higher low than the head, sitting at the same horizontal support as the left shoulder.
Neckline (descending, about 160 at the projected breakout): the trendline connecting the November 2025 and May 2026 highs.
→ Measured target at 265, confirmed by Fibonacci
The head-to-neckline distance is 104.57 points. Projected up from a breakout near 160, it gives a target of about 265. That target lands almost exactly on the 50% Fibonacci retracement (267.52) of the entire decline from the 2025 high near 450 to the June 2026 low near 80. When a pattern target lines up with the midpoint of the whole bear market, it gives the level much more weight.
→ Falling parallel channel
Since the mid-September high, MSTR has pulled back inside a falling parallel channel, which forms the right shoulder. Price is now on the lower line, and a falling channel that develops after a strong advance (the July–September rally off the head) tends to resolve to the upside. A break above the channel top would be the first signal that the right shoulder is complete.
→ Hammer at support
Today’s candle printed a long lower wick down to 108.25 and closed near its high. That’s a hammer, sitting right at the confluence of the channel base and the horizontal support that held the left shoulder. It shows that buyers absorbed the intraday selling.
→ Resistance to clear on the way to TP2
Between TP1 and TP2 sits horizontal resistance at 189.71. This level capped price at the December - January highs and again at the May 2026 peak. A daily close above 189.71 after the neckline breakout would open the path to 265. A rejection there would be a natural place to take partial profits or trail the stop.
━━━━━━━━━━━━━━━━━━━━
3) TRADE PLAN
━━━━━━━━━━━━━━━━━━━━
ENTRY: 112.35 (CMP)
STOP LOSS: 87.00
TP1: 171.85
TP2: 265.00
RRR = 1:2.3 (TP1) | 1:6.0 (TP2)
━━━━━━━━━━━━━━━━━━━━
1) BACKDROP: WHY MSTR FOLLOWS BTC
━━━━━━━━━━━━━━━━━━━━
→ A Bitcoin proxy: Strategy’s balance sheet is built around its Bitcoin treasury, so the stock moves with BTC, and usually with more amplitude in both directions.
→ BTC higher low in progress: Bitcoin appears to be forming a higher low after the cycle bottom it made in June 2026. If that higher low holds, it provides the backdrop for MSTR to complete its right shoulder and turn higher.
→ MSTR is moving early: MSTR’s own reversal structure is taking shape ahead of a confirmed BTC trend change. If Bitcoin confirms, MSTR is already positioned for the move.
━━━━━━━━━━━━━━━━━━━━
2) TECHNICAL ANALYSIS (DAILY TIMEFRAME)
━━━━━━━━━━━━━━━━━━━━
→ Inverse head and shoulders
Left shoulder (early February 2026, about 105): the first capitulation low after the late-2025 selloff.
Head (late June 2026, about 80): the cycle low, set on the heaviest volume on the chart, which is a classic washout.
Right shoulder (forming now, about 108–112): a higher low than the head, sitting at the same horizontal support as the left shoulder.
Neckline (descending, about 160 at the projected breakout): the trendline connecting the November 2025 and May 2026 highs.
→ Measured target at 265, confirmed by Fibonacci
The head-to-neckline distance is 104.57 points. Projected up from a breakout near 160, it gives a target of about 265. That target lands almost exactly on the 50% Fibonacci retracement (267.52) of the entire decline from the 2025 high near 450 to the June 2026 low near 80. When a pattern target lines up with the midpoint of the whole bear market, it gives the level much more weight.
→ Falling parallel channel
Since the mid-September high, MSTR has pulled back inside a falling parallel channel, which forms the right shoulder. Price is now on the lower line, and a falling channel that develops after a strong advance (the July–September rally off the head) tends to resolve to the upside. A break above the channel top would be the first signal that the right shoulder is complete.
→ Hammer at support
Today’s candle printed a long lower wick down to 108.25 and closed near its high. That’s a hammer, sitting right at the confluence of the channel base and the horizontal support that held the left shoulder. It shows that buyers absorbed the intraday selling.
→ Resistance to clear on the way to TP2
Between TP1 and TP2 sits horizontal resistance at 189.71. This level capped price at the December - January highs and again at the May 2026 peak. A daily close above 189.71 after the neckline breakout would open the path to 265. A rejection there would be a natural place to take partial profits or trail the stop.
━━━━━━━━━━━━━━━━━━━━
3) TRADE PLAN
━━━━━━━━━━━━━━━━━━━━
ENTRY: 112.35 (CMP)
STOP LOSS: 87.00
TP1: 171.85
TP2: 265.00
RRR = 1:2.3 (TP1) | 1:6.0 (TP2)

Clause de non-responsabilité
Les informations et publications ne sont pas destinées à être, et ne constituent pas, des conseils ou recommandations financiers, d'investissement, de trading ou autres fournis ou approuvés par TradingView. Pour en savoir plus, consultez les Conditions d'utilisation.
Clause de non-responsabilité
Les informations et publications ne sont pas destinées à être, et ne constituent pas, des conseils ou recommandations financiers, d'investissement, de trading ou autres fournis ou approuvés par TradingView. Pour en savoir plus, consultez les Conditions d'utilisation.