
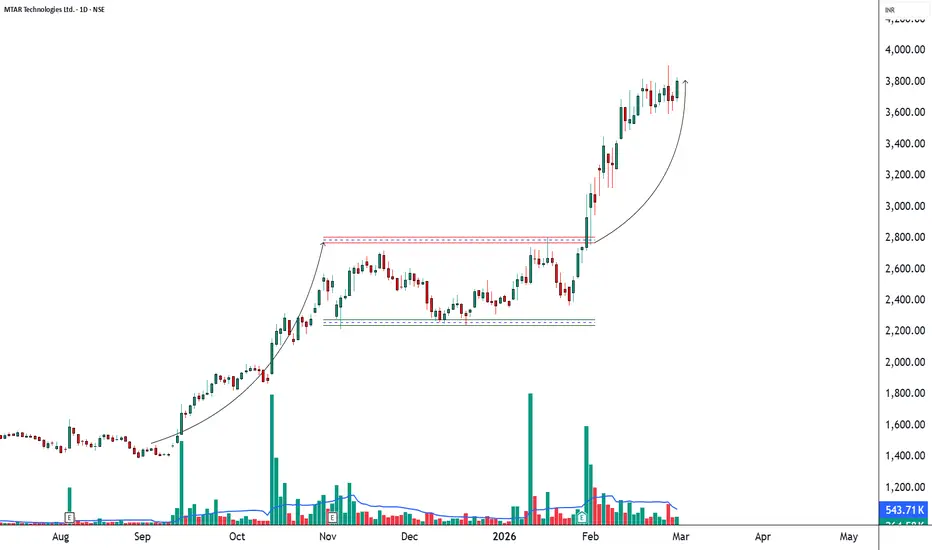
📊 MTARTECH – STWP Equity Snapshot
Ticker: NSE: MTARTECH
Sector: Industrial Engineering / Precision Manufacturing
CMP: 3,806.80 ▲ (+3.35% | 27 Feb 2026)
Learning Rating: ⭐⭐⭐☆☆ (Extended Move Near Range High)
Chart Pattern Observed: Strong Vertical Expansion into Supply
Candlestick Context: Bullish Continuation Candle with Normal Participation
MTARTECH has witnessed a sharp vertical recovery from recent swing lows, reclaiming prior consolidation zones and pushing toward the upper end of its broader range structure. The move has been fast and directional, reflecting buyer dominance in the short term. However, the current structure still resembles a range expansion attempt rather than a confirmed higher timeframe breakout.
RSI is positioned near 71.99, entering overbought territory. While strong RSI readings often accompany trending phases, they also increase the probability of short-term cooling or consolidation, especially when price approaches layered resistance. MACD remains supportive of bullish momentum, but the velocity of the move suggests that risk-reward becomes more sensitive at elevated levels.
From a CPR perspective, price is holding above the pivot zone, and projected levels indicate a tightening structure. However, participation remains normal with relative volume at 0.73, which does not yet reflect aggressive expansion. This implies that while momentum is positive, conviction is not yet extreme. Immediate resistance lies in the 3,866–3,925 zone, followed by the broader supply band near 4,021. Sustained acceptance above these levels would be required to validate structural continuation beyond the current range.
Volume Analysis
Current volume is within the normal band, with relative volume at 0.73 times average participation. The advance is not accompanied by aggressive expansion in activity, suggesting a controlled rise rather than institutional acceleration. Continuation strength will depend on whether volume expands meaningfully near resistance. Without expansion, the move may transition into range-bound consolidation.
Key Levels – Daily Timeframe
Primary support areas are located near 3,711, followed by 3,615 and 3,556. On the upside, resistance zones are positioned around 3,866, 3,925, and 4,021. These areas have historically acted as reaction points and remain critical for continuation or rejection behaviour.
Structure Read – What Matters Now
The key observation is the vertical recovery into upper range supply without strong volume expansion. The focus now shifts to whether price can achieve acceptance above the 3,866–3,925 resistance cluster. Sustained trade below 3,658 would weaken the current recovery leg and increase the probability of pullback into prior value zones. The primary risk lies in overextension with RSI in elevated territory. The most probable near-term path is either controlled consolidation below resistance or a breakout attempt contingent on fresh participation.
Price Reference Framework – Educational View
From an intraday perspective, the observation zone lies around 3,830, with risk invalidation below 3,666. Upside reference zones are positioned near 3,993 and 4,157. These levels are intended purely for studying short-term price behaviour and structural interaction.
From a swing perspective over the next two to five sessions, the observation zone remains around 3,830, with structural invalidation below 3,658. Upside reference zones extend toward 4,172 and 4,430, and become relevant only if price sustains above reclaimed resistance.
STWP View
Momentum is moderate while the broader trend remains range-bound. Risk is elevated due to overbought RSI conditions and proximity to resistance. Volume remains normal and not yet expansionary. Sentiment is neutral, and the session registered a 3.35 percent advance.
Final Outlook
Momentum: Moderate
Trend: Range
Risk: High
Volume: Low
📘Learning Note
When RSI enters elevated territory near resistance, discipline becomes more important than excitement. Structure and acceptance decide continuation, not speed of move.
⚠️ Disclaimer
This post is intended solely for educational and informational purposes. It does not constitute investment advice, a recommendation, or a solicitation to buy or sell any security. Market investments are subject to risk. Please consult a SEBI-registered financial advisor before making any investment decisions. STWP is not responsible for actions taken based on this analysis.
💬Did this help you read the chart better?
🔼 Boost | ✍️ Comment | 🔁 Share with a learner
👉 Follow STWP for clean chart-reading insights
Stay Calm. Stay Clean. Trade With Patience.

STWP | Mentor & Demand-Supply Specialist |
Empowering traders through structured learning |
simpletradewithpatience.com
chat.whatsapp.com/CpgyHCfioQ5Hxf7rd8pDqw
wa.me/message/6IOPHGOXMGZ4N1
Educational Only
Empowering traders through structured learning |
simpletradewithpatience.com
chat.whatsapp.com/CpgyHCfioQ5Hxf7rd8pDqw
wa.me/message/6IOPHGOXMGZ4N1
Educational Only
Clause de non-responsabilité
Les informations et publications ne sont pas destinées à être, et ne constituent pas, des conseils ou recommandations financiers, d'investissement, de trading ou autres fournis ou approuvés par TradingView. Pour en savoir plus, consultez les Conditions d'utilisation.