
Micron Technology (MU): Weekly Chart Analysis
Date: 6 November 2026 | Timeframe: Weekly | Exchange: NASDAQ
Summary
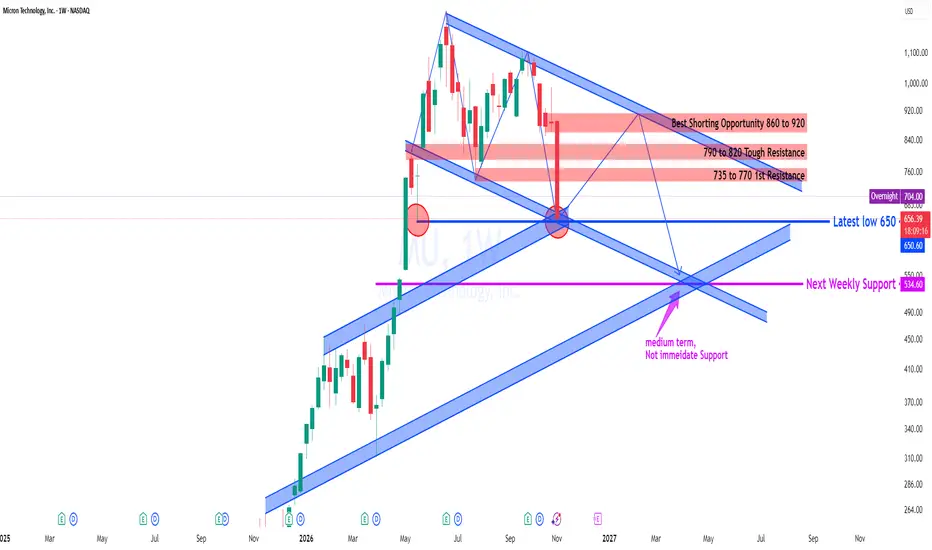
Micron has dropped hard this week. The stock fell about 25.8%, from around $890 to $656, and touched a low of $650. This was the biggest weekly decline since its strong rally in 2026. Price has now reached an important technical support area where two trendlines meet.
Key Observations
1. The trend has turned from rally to correction
MU rose sharply from about $290 in early 2026 to a peak near $1,150–1,200 in June 2026. Since then, the stock has made lower highs inside a downward-sloping channel. That pattern points to a medium-term correction.
2. Price is sitting at support for now ($650)
This week’s low at $650 lines up with two levels:
the lower boundary of the falling channel, and
the upper line of the earlier rising channel, which used to be resistance and is now being tested as support.
Because these two lines meet here, a short-term relief bounce is possible from this zone. The overnight price of around $695 suggests some buyers are already stepping in.
3. Resistance levels to watch on a bounce
Zone Level Significance
1st Resistance $735 – $770 First area where selling may show up
Tough Resistance $790 – $820 Previous breakdown zone, which may be hard to cross
Key Supply Zone $860 – $920 Strongest resistance; it also lines up with the falling channel’s upper trendline
4. Possible scenario
The chart suggests a bounce toward $860–920 in the coming months, possibly by early 2027. If price gets rejected there, it could fall again toward the next weekly support near $535, around the first half of 2027.
5. Medium-term support: about $535
The $534.60 level sits where the falling channel’s lower line meets the long-term rising trendline from the late-2025 lows. This is a medium-term support, not an immediate one.
Bottom Line
MU has corrected sharply and is now at a key support near $650, where a short-term bounce is possible. The overall structure still points to a “sell on rise” setup, with strong resistance at $860–920. A weekly close below $650 would weaken the support and could open the way toward $535. Traders should wait for price to confirm at these levels before acting.
Key Levels at a Glance
Immediate support: $650
Medium-term support: $535
Resistance: $735–770 / $790–820 / $860–920
Bias: Short-term bounce is possible, but the medium-term trend stays corrective while price is below the falling channel
⚠️ Disclaimer
This analysis is for educational and informational purposes only. It is not investment advice, a recommendation, or a solicitation to buy, sell, or hold any security. The views are based on technical chart patterns, which may not predict future price movements. Trading stocks, especially short selling, involves substantial risk, including the possible loss of more than your initial investment. Past performance does not guarantee future results. Readers should do their own research and/or consult a licensed financial advisor before making any investment or trading decisions. The author is not responsible for any losses arising from the use of this information. The author may or may not hold positions in the security mentioned.
Date: 6 November 2026 | Timeframe: Weekly | Exchange: NASDAQ
Summary
Micron has dropped hard this week. The stock fell about 25.8%, from around $890 to $656, and touched a low of $650. This was the biggest weekly decline since its strong rally in 2026. Price has now reached an important technical support area where two trendlines meet.
Key Observations
1. The trend has turned from rally to correction
MU rose sharply from about $290 in early 2026 to a peak near $1,150–1,200 in June 2026. Since then, the stock has made lower highs inside a downward-sloping channel. That pattern points to a medium-term correction.
2. Price is sitting at support for now ($650)
This week’s low at $650 lines up with two levels:
the lower boundary of the falling channel, and
the upper line of the earlier rising channel, which used to be resistance and is now being tested as support.
Because these two lines meet here, a short-term relief bounce is possible from this zone. The overnight price of around $695 suggests some buyers are already stepping in.
3. Resistance levels to watch on a bounce
Zone Level Significance
1st Resistance $735 – $770 First area where selling may show up
Tough Resistance $790 – $820 Previous breakdown zone, which may be hard to cross
Key Supply Zone $860 – $920 Strongest resistance; it also lines up with the falling channel’s upper trendline
4. Possible scenario
The chart suggests a bounce toward $860–920 in the coming months, possibly by early 2027. If price gets rejected there, it could fall again toward the next weekly support near $535, around the first half of 2027.
5. Medium-term support: about $535
The $534.60 level sits where the falling channel’s lower line meets the long-term rising trendline from the late-2025 lows. This is a medium-term support, not an immediate one.
Bottom Line
MU has corrected sharply and is now at a key support near $650, where a short-term bounce is possible. The overall structure still points to a “sell on rise” setup, with strong resistance at $860–920. A weekly close below $650 would weaken the support and could open the way toward $535. Traders should wait for price to confirm at these levels before acting.
Key Levels at a Glance
Immediate support: $650
Medium-term support: $535
Resistance: $735–770 / $790–820 / $860–920
Bias: Short-term bounce is possible, but the medium-term trend stays corrective while price is below the falling channel
⚠️ Disclaimer
This analysis is for educational and informational purposes only. It is not investment advice, a recommendation, or a solicitation to buy, sell, or hold any security. The views are based on technical chart patterns, which may not predict future price movements. Trading stocks, especially short selling, involves substantial risk, including the possible loss of more than your initial investment. Past performance does not guarantee future results. Readers should do their own research and/or consult a licensed financial advisor before making any investment or trading decisions. The author is not responsible for any losses arising from the use of this information. The author may or may not hold positions in the security mentioned.

Clause de non-responsabilité
Les informations et publications ne sont pas destinées à être, et ne constituent pas, des conseils ou recommandations financiers, d'investissement, de trading ou autres fournis ou approuvés par TradingView. Pour en savoir plus, consultez les Conditions d'utilisation.
Clause de non-responsabilité
Les informations et publications ne sont pas destinées à être, et ne constituent pas, des conseils ou recommandations financiers, d'investissement, de trading ou autres fournis ou approuvés par TradingView. Pour en savoir plus, consultez les Conditions d'utilisation.