
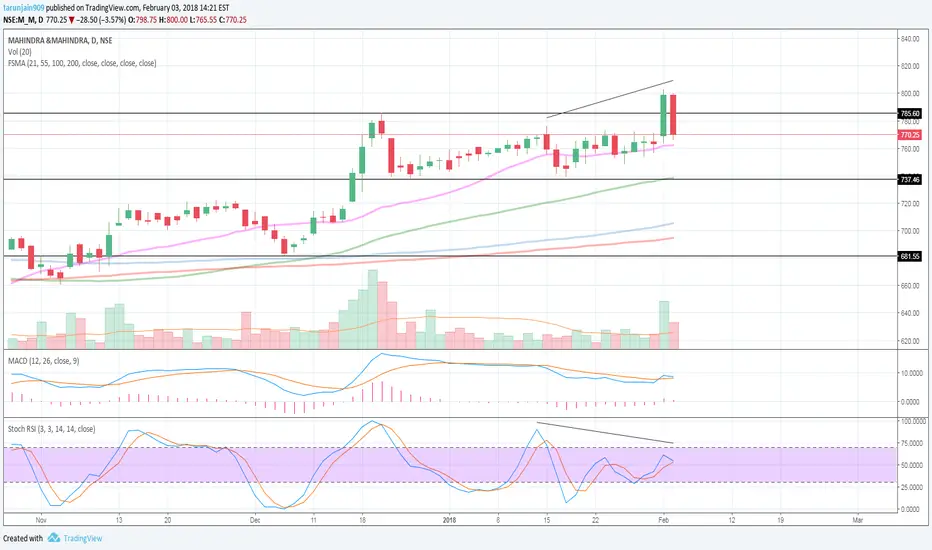
M&M showing signs of trend reversal here..
Signals -
1. RSI divergence
2. Overbought
3. Bearish Engulf Candle
Targets on the right in black.
This chart is for study/educational purpose only.
Please DYOR.
I won't be liable for any P/L made by using above chart.
Signals -
1. RSI divergence
2. Overbought
3. Bearish Engulf Candle
Targets on the right in black.
This chart is for study/educational purpose only.
Please DYOR.
I won't be liable for any P/L made by using above chart.
Note
As shown on chart, T1 and T2 are met.Trade fermée: cible de profit atteinte

Clause de non-responsabilité
Les informations et publications ne sont pas destinées à être, et ne constituent pas, des conseils ou recommandations financiers, d'investissement, de trading ou autres fournis ou approuvés par TradingView. Pour en savoir plus, consultez les Conditions d'utilisation.
Clause de non-responsabilité
Les informations et publications ne sont pas destinées à être, et ne constituent pas, des conseils ou recommandations financiers, d'investissement, de trading ou autres fournis ou approuvés par TradingView. Pour en savoir plus, consultez les Conditions d'utilisation.