
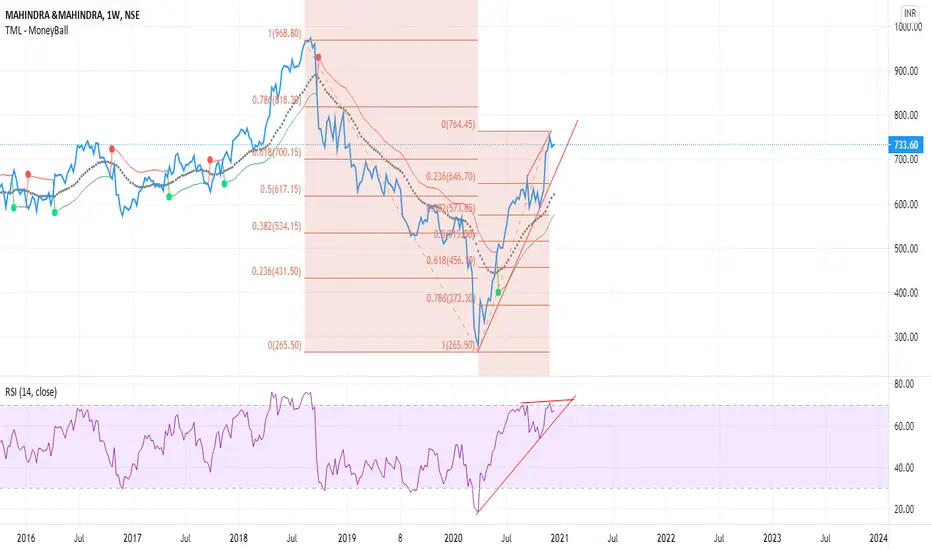
M&M on weekly time frames is poised to correct.
Currently, hidden negative divergences are clearly visible on the chart.
Even though, the price has established a new high post-September 2020 however, RSI failed to establish a new high and its the first sign of loss of momentum.
Applying the Elliot wave theory
From march lows of 250 and recent highs of 760 - we can consider this as wave 1
Wave 2 - Usually corrects up to 61.% fibo levels which comes down to 450. However, 570 & 500 are also crucial levels to watch for any reversal signs.
Currently, hidden negative divergences are clearly visible on the chart.
Even though, the price has established a new high post-September 2020 however, RSI failed to establish a new high and its the first sign of loss of momentum.
Applying the Elliot wave theory
From march lows of 250 and recent highs of 760 - we can consider this as wave 1
Wave 2 - Usually corrects up to 61.% fibo levels which comes down to 450. However, 570 & 500 are also crucial levels to watch for any reversal signs.
Note
M&M saw a massive fall of over 7% today and made a low of 660. 640-650 is strong support since its 23.6% fibbo level... it is likely the stock will bounce from these levels to further test the 570-500 levels in future.

Clause de non-responsabilité
Les informations et publications ne sont pas destinées à être, et ne constituent pas, des conseils ou recommandations financiers, d'investissement, de trading ou autres fournis ou approuvés par TradingView. Pour en savoir plus, consultez les Conditions d'utilisation.
Clause de non-responsabilité
Les informations et publications ne sont pas destinées à être, et ne constituent pas, des conseils ou recommandations financiers, d'investissement, de trading ou autres fournis ou approuvés par TradingView. Pour en savoir plus, consultez les Conditions d'utilisation.