
Back in October, when Bitcoin was trading well above 100k, I raised a rhetorical question:
👉 Were those three months of range trading above 100k actually distribution, not reaccumulation?
The market eventually answered.
It was distribution.
And today, BTC is trading in what many would define as bearish market territory.
🔎 A Similar Picture on NAS100
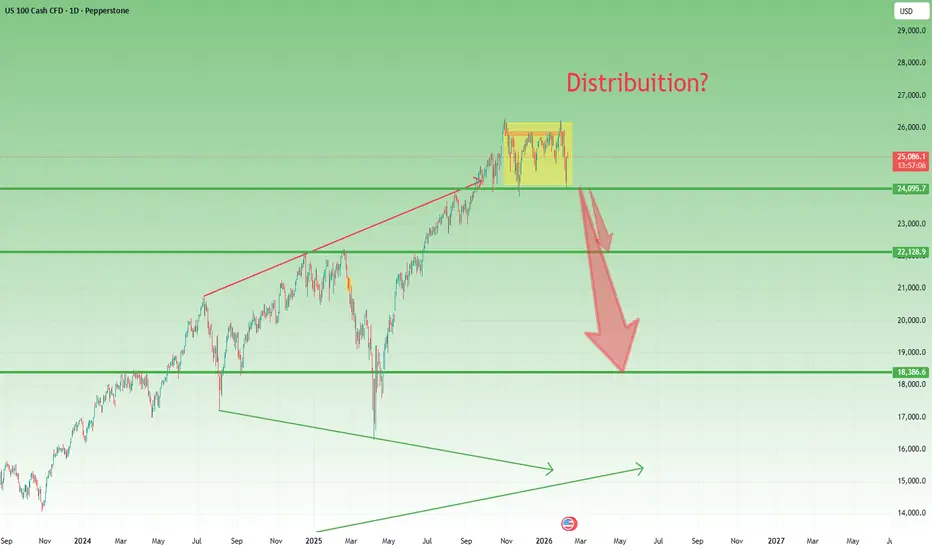
Now, when I look at the Nasdaq 100, I see a structure that feels uncomfortably similar.
Since October, price has been:
- choppy
- indecisive
- and, frankly, frustrating
For over four months, the index has gone mostly sideways, reacting only on news.
That behavior deserves attention.
📌 Clearly Defined Levels
Technically, the market has drawn its boundaries quite well:
- 26k resistance
- 24k support
- A roughly 10% range.
Simple structure, clear map.
⚖️ The Logic of a Range
Range trading implies:
- breakout up → continuation
- breakout down → correction
But markets are not only about logic — they’re about probability.
Given that price recently failed again near the highs, and did so quickly, the odds favor a downside break in the future.
⚠️ The Real Concern
A normal measured move from a 24k break would target 22k — about a 10% drop.
That alone is not dramatic.
That’s standard market behavior.
The concern is what comes after.
If 24k breaks decisively, I doubt price will simply stop at 22k.
The risk is a deeper move toward:
👉 18k zone
And a decline of that magnitude would likely reflect:
- broader economic weakness
- recession
- cross-market contagion
✅ Final Thought
This is not a prediction — it’s a scenario to be aware of.
Markets rarely warn loudly before shifting regimes.
They usually whisper first through structure.
And right now, the structure is a warning.
Let’s hope this scenario doesn’t play out — but as traders, hope is not a strategy. 🚀
👉 Were those three months of range trading above 100k actually distribution, not reaccumulation?
The market eventually answered.
It was distribution.
And today, BTC is trading in what many would define as bearish market territory.
🔎 A Similar Picture on NAS100
Now, when I look at the Nasdaq 100, I see a structure that feels uncomfortably similar.
Since October, price has been:
- choppy
- indecisive
- and, frankly, frustrating
For over four months, the index has gone mostly sideways, reacting only on news.
That behavior deserves attention.
📌 Clearly Defined Levels
Technically, the market has drawn its boundaries quite well:
- 26k resistance
- 24k support
- A roughly 10% range.
Simple structure, clear map.
⚖️ The Logic of a Range
Range trading implies:
- breakout up → continuation
- breakout down → correction
But markets are not only about logic — they’re about probability.
Given that price recently failed again near the highs, and did so quickly, the odds favor a downside break in the future.
⚠️ The Real Concern
A normal measured move from a 24k break would target 22k — about a 10% drop.
That alone is not dramatic.
That’s standard market behavior.
The concern is what comes after.
If 24k breaks decisively, I doubt price will simply stop at 22k.
The risk is a deeper move toward:
👉 18k zone
And a decline of that magnitude would likely reflect:
- broader economic weakness
- recession
- cross-market contagion
✅ Final Thought
This is not a prediction — it’s a scenario to be aware of.
Markets rarely warn loudly before shifting regimes.
They usually whisper first through structure.
And right now, the structure is a warning.
Let’s hope this scenario doesn’t play out — but as traders, hope is not a strategy. 🚀

🎯 Want More Trading Ideas?
📈 Join the FREE Forex & Gold Channel
👉 t.me/intradaytradingsignals
💎 Join the FREE Crypto Channel
👉 t.me/FanCryptocurrency
📈 Join the FREE Forex & Gold Channel
👉 t.me/intradaytradingsignals
💎 Join the FREE Crypto Channel
👉 t.me/FanCryptocurrency
Publications connexes
Clause de non-responsabilité
Les informations et publications ne sont pas destinées à être, et ne constituent pas, des conseils ou recommandations financiers, d'investissement, de trading ou autres fournis ou approuvés par TradingView. Pour en savoir plus, consultez les Conditions d'utilisation.
🎯 Want More Trading Ideas?
📈 Join the FREE Forex & Gold Channel
👉 t.me/intradaytradingsignals
💎 Join the FREE Crypto Channel
👉 t.me/FanCryptocurrency
📈 Join the FREE Forex & Gold Channel
👉 t.me/intradaytradingsignals
💎 Join the FREE Crypto Channel
👉 t.me/FanCryptocurrency
Publications connexes
Clause de non-responsabilité
Les informations et publications ne sont pas destinées à être, et ne constituent pas, des conseils ou recommandations financiers, d'investissement, de trading ou autres fournis ou approuvés par TradingView. Pour en savoir plus, consultez les Conditions d'utilisation.