
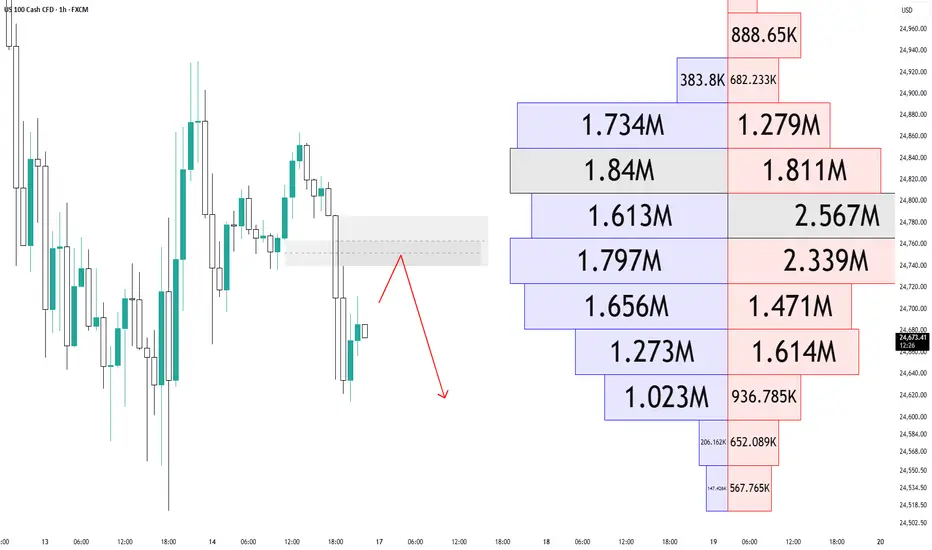
1️⃣ Structural Situation
A range formed at the top.
The gray area represents a supply / distribution zone.
A strong downside displacement occurred from that zone.
After the drop, price is showing a weak reaction (possible dead cat bounce).
The primary flow is currently bearish.
2️⃣ Volume Profile Reading
The footprint / volume distribution on the right side is critical:
Heavy volume clusters around 1.613M – 1.797M – 2.339M – 2.567M.
The largest volume node is 2.567M → this signals acceptance.
Upper nodes such as 1.734M and 1.84M may now act as supply.
What this suggests:
Even if price bounces,
volume structure does not support sustained upside.
Seller participation appears more organized.
3️⃣ Higher Probability Scenario
🔴 Most likely scenario:
Pullback into the gray supply zone
Formation of a lower high
Liquidity sweep below the recent low
Continuation toward 24,620 – 24,580
Reasons:
Clear downside displacement
Weak recovery structure
Volume acceptance below
4️⃣ Invalidation Conditions
The bearish scenario weakens if we see:
A strong high-volume close above the gray zone
Clear positive delta expansion
A higher high instead of a lower high
Without those, rallies are likely to be selling opportunities.
A range formed at the top.
The gray area represents a supply / distribution zone.
A strong downside displacement occurred from that zone.
After the drop, price is showing a weak reaction (possible dead cat bounce).
The primary flow is currently bearish.
2️⃣ Volume Profile Reading
The footprint / volume distribution on the right side is critical:
Heavy volume clusters around 1.613M – 1.797M – 2.339M – 2.567M.
The largest volume node is 2.567M → this signals acceptance.
Upper nodes such as 1.734M and 1.84M may now act as supply.
What this suggests:
Even if price bounces,
volume structure does not support sustained upside.
Seller participation appears more organized.
3️⃣ Higher Probability Scenario
🔴 Most likely scenario:
Pullback into the gray supply zone
Formation of a lower high
Liquidity sweep below the recent low
Continuation toward 24,620 – 24,580
Reasons:
Clear downside displacement
Weak recovery structure
Volume acceptance below
4️⃣ Invalidation Conditions
The bearish scenario weakens if we see:
A strong high-volume close above the gray zone
Clear positive delta expansion
A higher high instead of a lower high
Without those, rallies are likely to be selling opportunities.
Transaction en cours
Trade fermée: cible de profit atteinte

Clause de non-responsabilité
Les informations et publications ne sont pas destinées à être, et ne constituent pas, des conseils ou recommandations financiers, d'investissement, de trading ou autres fournis ou approuvés par TradingView. Pour en savoir plus, consultez les Conditions d'utilisation.
Clause de non-responsabilité
Les informations et publications ne sont pas destinées à être, et ne constituent pas, des conseils ou recommandations financiers, d'investissement, de trading ou autres fournis ou approuvés par TradingView. Pour en savoir plus, consultez les Conditions d'utilisation.