nasdaq100....h
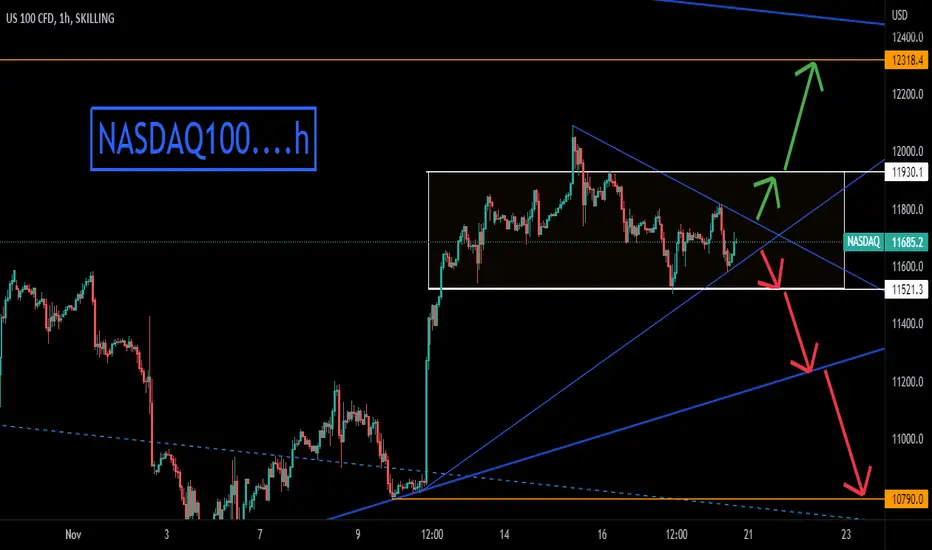
= Nasdaq analysis on the hourly chart
= The analysis is based on trend analysis, support and resistance
= Currently, it is on an occasional path between support and resistance.. breaking it goes to the selling targets... and exceeding it goes to the buying targets
= The analysis is based on trend analysis, support and resistance
= Currently, it is on an occasional path between support and resistance.. breaking it goes to the selling targets... and exceeding it goes to the buying targets

Clause de non-responsabilité
Les informations et publications ne sont pas destinées à être, et ne constituent pas, des conseils ou recommandations financiers, d'investissement, de trading ou autres fournis ou approuvés par TradingView. Pour en savoir plus, consultez les Conditions d'utilisation.
Clause de non-responsabilité
Les informations et publications ne sont pas destinées à être, et ne constituent pas, des conseils ou recommandations financiers, d'investissement, de trading ou autres fournis ou approuvés par TradingView. Pour en savoir plus, consultez les Conditions d'utilisation.