
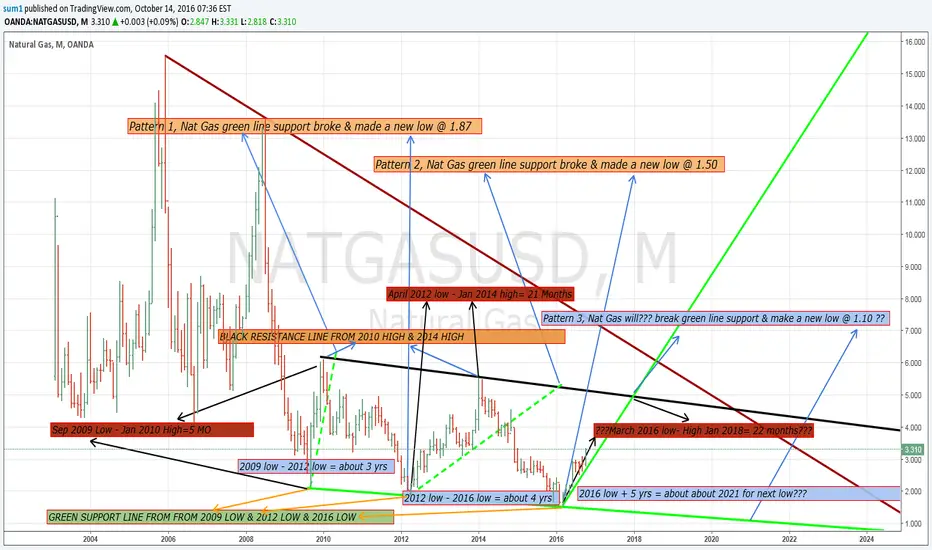
Pattern 1, Nat Gas green line support broke & made a new low @ 1.87
Pattern 2, Nat Gas green line support broke & made a new low @ 1.50
???Pattern 3, Nat Gas will??? break green line support & make a new low @ 1.10???
SOLID BLACK RESISTANCE LINE FROM 2010 HIGH & 2014 HIGH
GREEN SUPPORT LINE FROM FROM 2009 LOW & 2012 LOW & 2016 LOW
Sep 2009 Low - Jan 2010 High=5 MO
April 2012 low - Jan 2014 high= 21 Months
???March 2016 low- High Jan 2018= 22 months???
2009 low - 2012 low = about 3 yrs
2012 low - 2016 low = about 4 yrs
2016 low + 5 yrs = about about 2021 for next low???
Pattern 2, Nat Gas green line support broke & made a new low @ 1.50
???Pattern 3, Nat Gas will??? break green line support & make a new low @ 1.10???
SOLID BLACK RESISTANCE LINE FROM 2010 HIGH & 2014 HIGH
GREEN SUPPORT LINE FROM FROM 2009 LOW & 2012 LOW & 2016 LOW
Sep 2009 Low - Jan 2010 High=5 MO
April 2012 low - Jan 2014 high= 21 Months
???March 2016 low- High Jan 2018= 22 months???
2009 low - 2012 low = about 3 yrs
2012 low - 2016 low = about 4 yrs
2016 low + 5 yrs = about about 2021 for next low???

Publications connexes
Clause de non-responsabilité
Les informations et publications ne sont pas destinées à être, et ne constituent pas, des conseils ou recommandations financiers, d'investissement, de trading ou autres fournis ou approuvés par TradingView. Pour en savoir plus, consultez les Conditions d'utilisation.
Publications connexes
Clause de non-responsabilité
Les informations et publications ne sont pas destinées à être, et ne constituent pas, des conseils ou recommandations financiers, d'investissement, de trading ou autres fournis ou approuvés par TradingView. Pour en savoir plus, consultez les Conditions d'utilisation.