
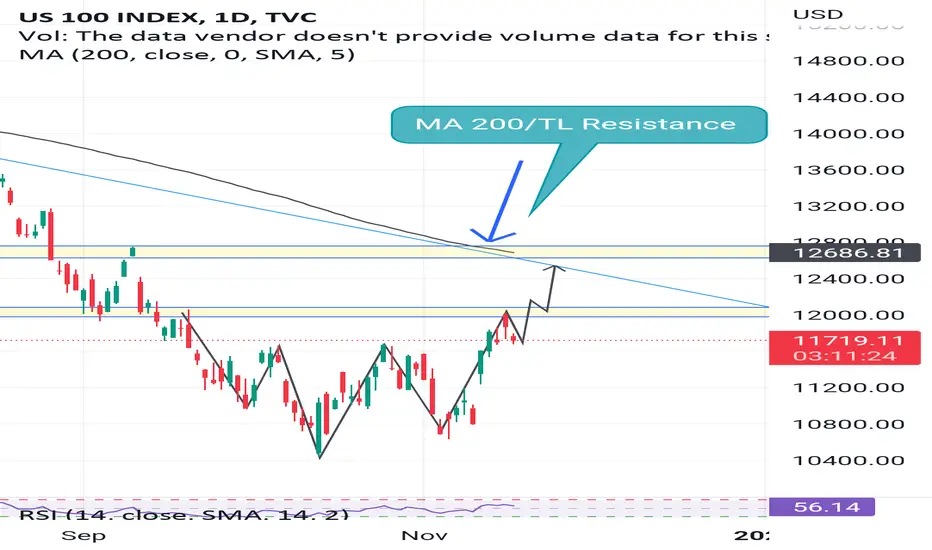
Nasdaq creating inverse head and shoulder pattern on daily chart and now testing the breakout neck line
It can easily go up to upper trendline and 200 Ma area which is also last high low were it has to chance to start fadingout as we are still in bear market 🐻
Micro bulish
Macro bearish
DYOR!
It can easily go up to upper trendline and 200 Ma area which is also last high low were it has to chance to start fadingout as we are still in bear market 🐻
Micro bulish
Macro bearish
DYOR!

Clause de non-responsabilité
Les informations et publications ne sont pas destinées à être, et ne constituent pas, des conseils ou recommandations financiers, d'investissement, de trading ou autres fournis ou approuvés par TradingView. Pour en savoir plus, consultez les Conditions d'utilisation.
Clause de non-responsabilité
Les informations et publications ne sont pas destinées à être, et ne constituent pas, des conseils ou recommandations financiers, d'investissement, de trading ou autres fournis ou approuvés par TradingView. Pour en savoir plus, consultez les Conditions d'utilisation.