NEDA Egypt should target 3.65 then 4.25
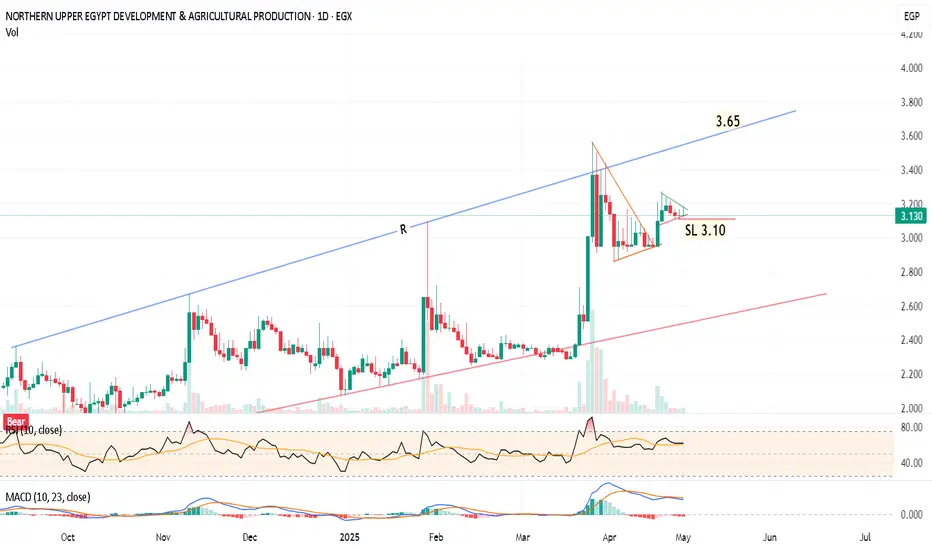
Daily chart,
the stock NEDA formed a pennant chart pattern and is forming another smaller pattern.
I am expecting some minor correction and consolidation around 3.10
Then, a bullish movement towards the resistance line R, at around 3.64 - 3.67
Stabilizing for 2 days above 3.70, will push the price to the next target 4.25
Note the resistance levels at 3.27, 3.44 , 3.56
(Closing below 3.10 for 2 days should be considered a near stop loss level)
the stock
NEDA formed a pennant chart pattern and is forming another smaller pattern. I am expecting some minor correction and consolidation around 3.10
Then, a bullish movement towards the resistance line R, at around 3.64 - 3.67
Stabilizing for 2 days above 3.70, will push the price to the next target 4.25
Note the resistance levels at 3.27, 3.44 , 3.56
(Closing below 3.10 for 2 days should be considered a near stop loss level)

Clause de non-responsabilité
Les informations et publications ne sont pas destinées à être, et ne constituent pas, des conseils ou recommandations financiers, d'investissement, de trading ou autres fournis ou approuvés par TradingView. Pour en savoir plus, consultez les Conditions d'utilisation.
Clause de non-responsabilité
Les informations et publications ne sont pas destinées à être, et ne constituent pas, des conseils ou recommandations financiers, d'investissement, de trading ou autres fournis ou approuvés par TradingView. Pour en savoir plus, consultez les Conditions d'utilisation.