
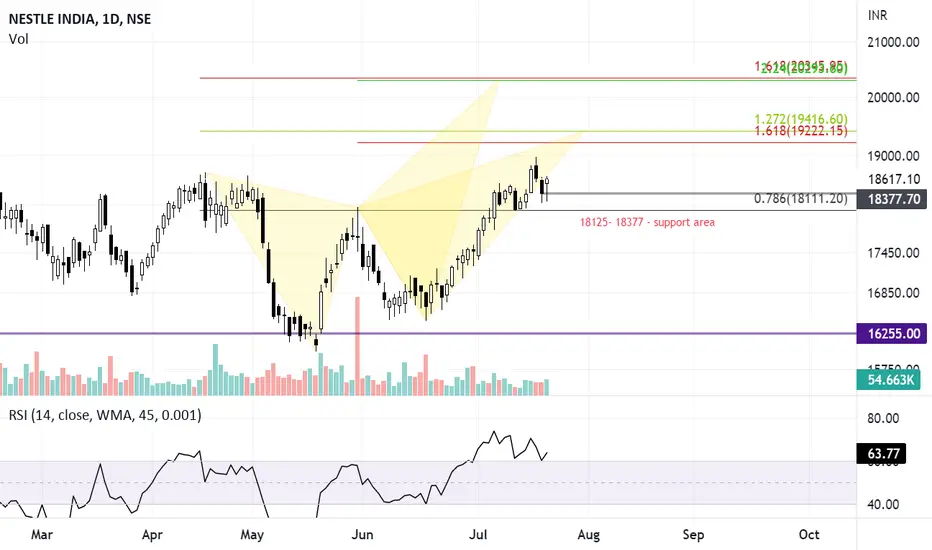
There is a probability of a butterfly pattern on the daily chart of NestleIndia.
Sustaining 18100, the stock might move towards 19200- 19400 in the coming sessions initially and then towards 20300-20350 levels.
Sustaining 18100, the stock might move towards 19200- 19400 in the coming sessions initially and then towards 20300-20350 levels.

Clause de non-responsabilité
Les informations et publications ne sont pas destinées à être, et ne constituent pas, des conseils ou recommandations financiers, d'investissement, de trading ou autres fournis ou approuvés par TradingView. Pour en savoir plus, consultez les Conditions d'utilisation.
Clause de non-responsabilité
Les informations et publications ne sont pas destinées à être, et ne constituent pas, des conseils ou recommandations financiers, d'investissement, de trading ou autres fournis ou approuvés par TradingView. Pour en savoir plus, consultez les Conditions d'utilisation.