
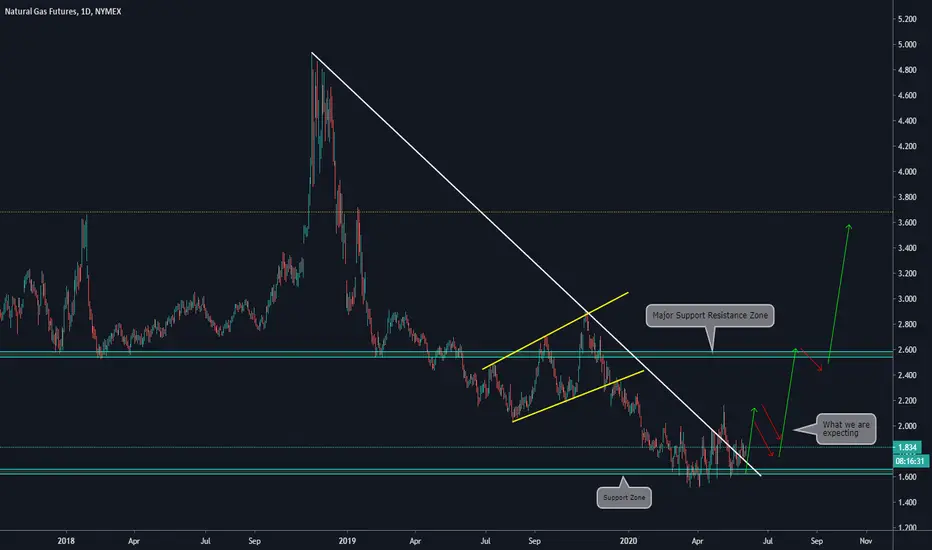
Main items we can see on the chart:
a) The price is on a well-tested support zone
b) The price has broken the descending trendline
c) We want to see a clear impulse outside the previous descending trendline + a 10-12 days correction
d) The reason we have decided that filter is because we observed similar behavior on the Weekly Chart in previous situations
WEEKLY CHART:

a) The price is on a well-tested support zone
b) The price has broken the descending trendline
c) We want to see a clear impulse outside the previous descending trendline + a 10-12 days correction
d) The reason we have decided that filter is because we observed similar behavior on the Weekly Chart in previous situations
WEEKLY CHART:

Publications connexes
Clause de non-responsabilité
Les informations et publications ne sont pas destinées à être, et ne constituent pas, des conseils ou recommandations financiers, d'investissement, de trading ou autres fournis ou approuvés par TradingView. Pour en savoir plus, consultez les Conditions d'utilisation.
Publications connexes
Clause de non-responsabilité
Les informations et publications ne sont pas destinées à être, et ne constituent pas, des conseils ou recommandations financiers, d'investissement, de trading ou autres fournis ou approuvés par TradingView. Pour en savoir plus, consultez les Conditions d'utilisation.