
Greetings fellow traders,
As time goes by, the markets evolve...
If your way of TA is strong, then the path will lead its way...
More visible, more probable:
Today's Note:
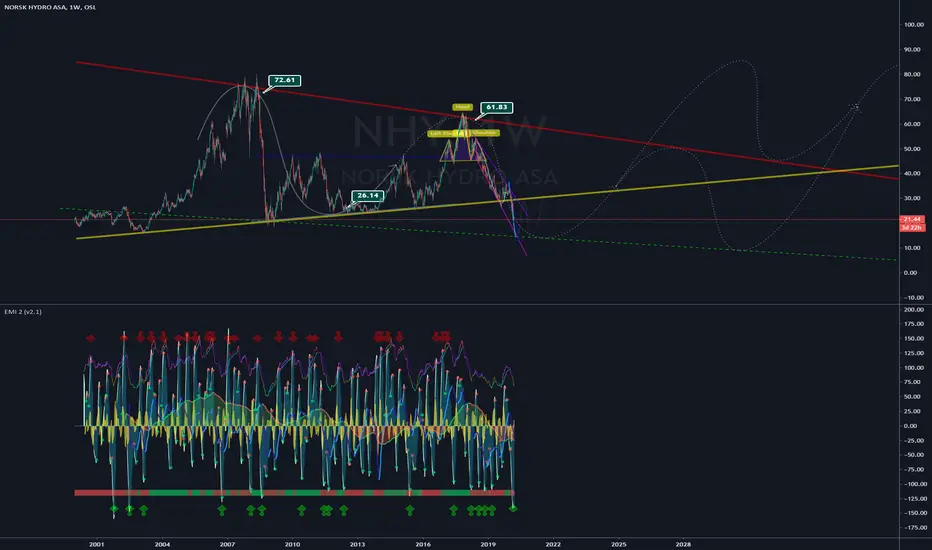
Pretty much the same story as NAS. This one is a bit peculiar though. My point is, and it's a strange one. The price actually must come down a little bit, confirming a lower low. With result that this chart creates a bull pattern. Instead of a bearish one, if it does find support on the current region. Nonetheless, it does make sense? When you look at the big picture.
Genuinely curious whether this going to play out as I'm forecasting today.
To be concluded...
As time goes by, the markets evolve...
If your way of TA is strong, then the path will lead its way...
More visible, more probable:
- Dashed lines; Possible forming patterns
- Solid lines; Confirmed patterns / Support or Resistance
- Dotted lines; Possible price-action trajectories / wave trend
- Lighten colors = Support | Darken colors = Resistance
Current Pattern Formation Level: - Alpha pattern: Symmetrical Triangle -> Bullish Pennant
- Beta pattern: Descending Broadening Wedge
- Possible Echo Pattern: Descending Broadening Wedge
Today's Note:
Pretty much the same story as NAS. This one is a bit peculiar though. My point is, and it's a strange one. The price actually must come down a little bit, confirming a lower low. With result that this chart creates a bull pattern. Instead of a bearish one, if it does find support on the current region. Nonetheless, it does make sense? When you look at the big picture.
Genuinely curious whether this going to play out as I'm forecasting today.
To be concluded...

Clause de non-responsabilité
Les informations et publications ne sont pas destinées à être, et ne constituent pas, des conseils ou recommandations financiers, d'investissement, de trading ou autres fournis ou approuvés par TradingView. Pour en savoir plus, consultez les Conditions d'utilisation.
Clause de non-responsabilité
Les informations et publications ne sont pas destinées à être, et ne constituent pas, des conseils ou recommandations financiers, d'investissement, de trading ou autres fournis ou approuvés par TradingView. Pour en savoir plus, consultez les Conditions d'utilisation.