
NIFTY 50 – Close Below 50 EMA & SMA | Downside Levels Identified
Technical View:
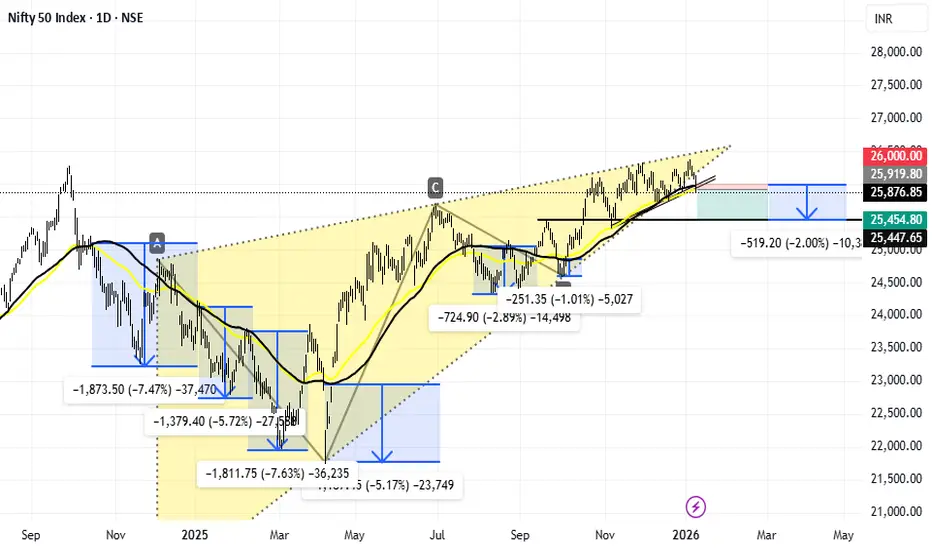
Over the last two years, NIFTY has consistently shown that a daily close below both the 50 EMA and 50 SMA results in an average correction of 4–5%.
🔍 Current Structure:
Price has closed below 50 EMA & 50 SMA
Rising wedge structure near the top → breakdown risk
Weak follow-through after the recent high
🎯 Downside Levels (Supports & Targets)
🔹 Immediate Support: 25,450 – 25,400
(Recent demand zone & neckline support)
🔹 Target 1 (≈2%): 25,350 – 25,250
(First reaction zone after breakdown)
🔹 Target 2 (≈3%): 25,100 – 25,000
(Psychological level + prior consolidation)
🔹 Extended Target (4–5%): 24,600 – 24,400
(Historical average correction zone based on EMA/SMA breakdowns)
📌 Invalidation / Resistance
Resistance: 25,900 – 26,000
(A move back above this zone negates the immediate bearish view)
⚠️ Disclaimer:
This analysis is based purely on technical probabilities and historical behavior. Not a buy/sell recommendation. Use strict risk management.
Over the last two years, NIFTY has consistently shown that a daily close below both the 50 EMA and 50 SMA results in an average correction of 4–5%.
🔍 Current Structure:
Price has closed below 50 EMA & 50 SMA
Rising wedge structure near the top → breakdown risk
Weak follow-through after the recent high
🎯 Downside Levels (Supports & Targets)
🔹 Immediate Support: 25,450 – 25,400
(Recent demand zone & neckline support)
🔹 Target 1 (≈2%): 25,350 – 25,250
(First reaction zone after breakdown)
🔹 Target 2 (≈3%): 25,100 – 25,000
(Psychological level + prior consolidation)
🔹 Extended Target (4–5%): 24,600 – 24,400
(Historical average correction zone based on EMA/SMA breakdowns)
📌 Invalidation / Resistance
Resistance: 25,900 – 26,000
(A move back above this zone negates the immediate bearish view)
⚠️ Disclaimer:
This analysis is based purely on technical probabilities and historical behavior. Not a buy/sell recommendation. Use strict risk management.
Transaction en cours
🔄 What to Expect NextA retest of the 26,000 resistance zone is likely
This zone also aligns with EMA/SMA resistance
Selling pressure is expected near 26,000
If rejection occurs, the downward move may resume
🎯 Downside Levels (Supports & Targets)
🔹 Immediate Support: 25,450 – 25,400 (tested)
🔹 Target 1 (≈2%): 25,350 – 25,250
🔹 Target 2 (≈3%): 25,100 – 25,000
🔹 Extended Target (4–5%): 24,600 – 24,400

Clause de non-responsabilité
Les informations et publications ne sont pas destinées à être, et ne constituent pas, des conseils ou recommandations financiers, d'investissement, de trading ou autres fournis ou approuvés par TradingView. Pour en savoir plus, consultez les Conditions d'utilisation.
Clause de non-responsabilité
Les informations et publications ne sont pas destinées à être, et ne constituent pas, des conseils ou recommandations financiers, d'investissement, de trading ou autres fournis ou approuvés par TradingView. Pour en savoir plus, consultez les Conditions d'utilisation.