
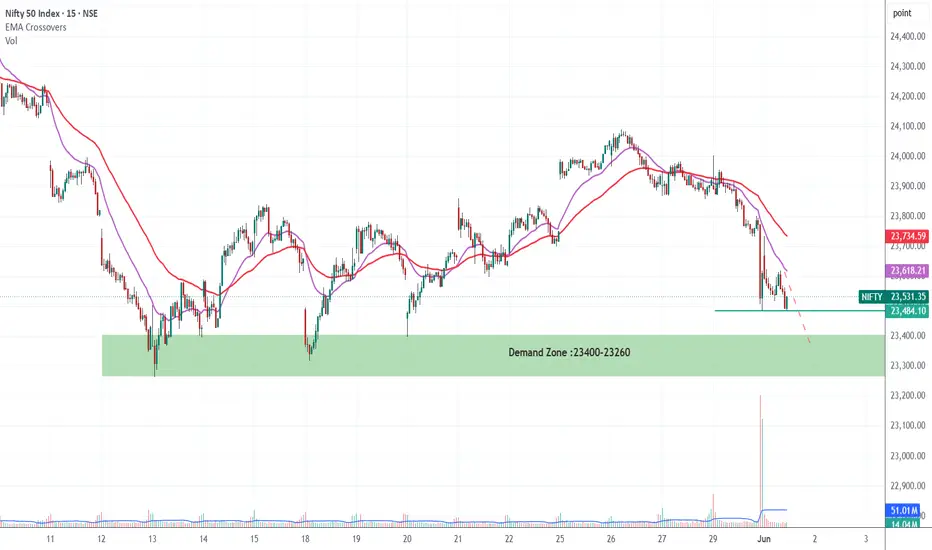
NIFTY is showing weakness on the 15-minute chart, hourly chart even daily chart as price continues trading below both EMAs, indicating bearish momentum. A sharp breakdown with strong volume confirms seller dominance, while the 23400–23260 demand zone is now the key area to watch. If buyers defend this zone, a short-term bounce is possible, but a breakdown below it may trigger further downside pressure.
Transaction en cours
Now Nifty Entered into Demand Zone, it may remain Sidways for sometimeTrade fermée: cible de profit atteinte

Clause de non-responsabilité
Les informations et publications ne sont pas destinées à être, et ne constituent pas, des conseils ou recommandations financiers, d'investissement, de trading ou autres fournis ou approuvés par TradingView. Pour en savoir plus, consultez les Conditions d'utilisation.
Clause de non-responsabilité
Les informations et publications ne sont pas destinées à être, et ne constituent pas, des conseils ou recommandations financiers, d'investissement, de trading ou autres fournis ou approuvés par TradingView. Pour en savoir plus, consultez les Conditions d'utilisation.