
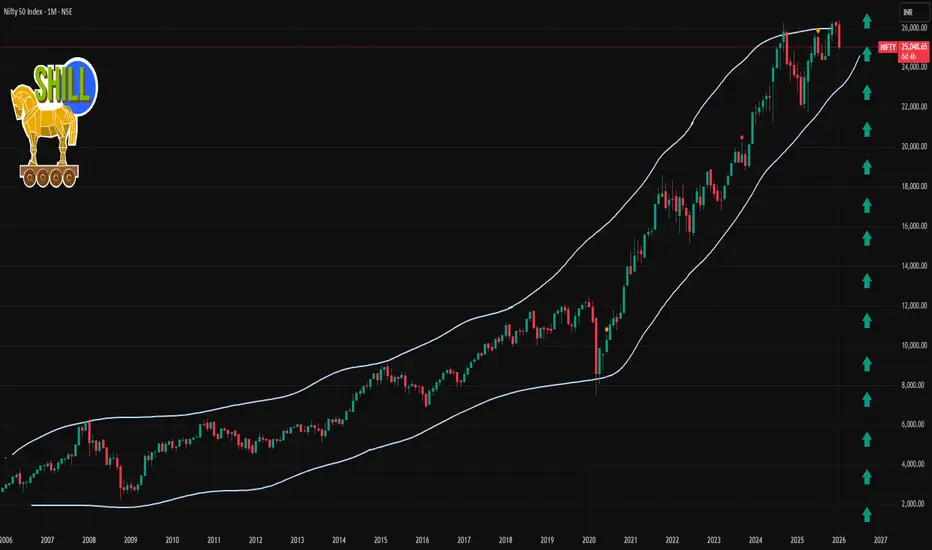
📊 Live Price & Performance (1 Month)
Nifty 50 Index: 25,048.65 (close on 23 Jan 2026)
• Declined ~‑4.3% over the past month.
• 1‑month high ~26,373 / low ~24,919.
📈 Key 1‑Month Technical Levels
🎯 Resistance (Upside)
1. 26,000 – 26,100 — Immediate resistance zone where supply likely increases and prior range top is placed.
2. ~26,300 — 1‑month swing high / recent high area.
Breaking above 26,100–26,300 with momentum would signal a stronger upside breakout.
🛡️ Support (Downside)
1. 25,600 – 25,700 — Key short‑term support cluster (holds medium‑term bullish bias if above this).
2. ~25,000 — Psychological and technical support level (also near recent lows).
3. 24,900 – 24,800 — Lower demand zone from recent 1‑month range.
A breakdown below 25,000 could accelerate downside, while holding above 25,600‑25,700 keeps bulls in control.
📌 What to Watch Next
Bullish breakout trigger: Close above 26,100–26,300.
Bearish catalyst: Sustained move below 25,000.
Neutral/sideways trade: Oscillation between 25,000 and 26,100.

Contact Knowledgehub for a detailed consultation: Dm on WhatsApp: [wa.link/a2o0kz]-
Phone No: [+91 93102 26243]-
Email: [tradingviewknowledgehub@gmail.com]---
-- Let’s achieve success together!
Phone No: [+91 93102 26243]-
Email: [tradingviewknowledgehub@gmail.com]---
-- Let’s achieve success together!
Publications connexes
Clause de non-responsabilité
Les informations et publications ne sont pas destinées à être, et ne constituent pas, des conseils ou recommandations financiers, d'investissement, de trading ou autres fournis ou approuvés par TradingView. Pour en savoir plus, consultez les Conditions d'utilisation.