
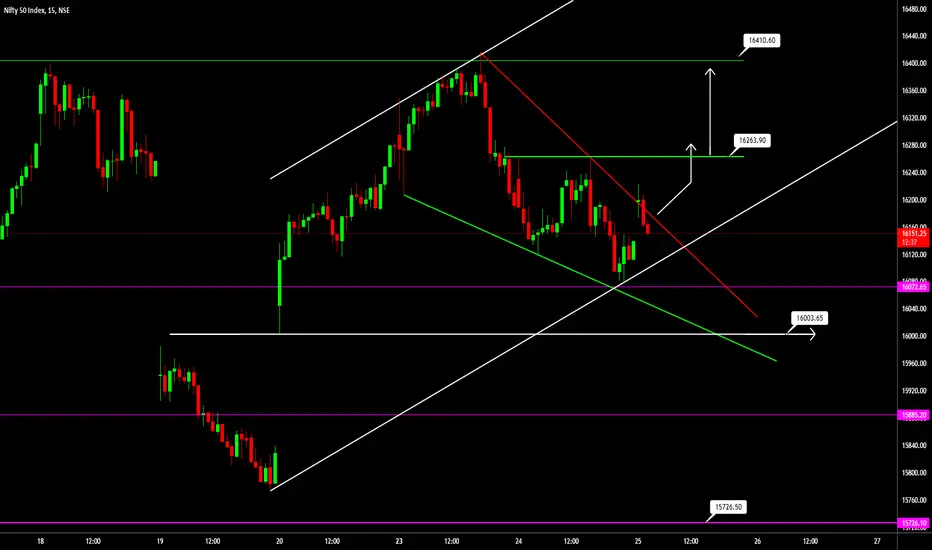
Pattern - Falling wedge
Pattern type - bullish
Immediate resistance 16260
Target after resistance - 16400
Important support - 16000
Pattern type - bullish
Immediate resistance 16260
Target after resistance - 16400
Important support - 16000

Clause de non-responsabilité
Les informations et publications ne sont pas destinées à être, et ne constituent pas, des conseils ou recommandations financiers, d'investissement, de trading ou autres fournis ou approuvés par TradingView. Pour en savoir plus, consultez les Conditions d'utilisation.
Clause de non-responsabilité
Les informations et publications ne sont pas destinées à être, et ne constituent pas, des conseils ou recommandations financiers, d'investissement, de trading ou autres fournis ou approuvés par TradingView. Pour en savoir plus, consultez les Conditions d'utilisation.