
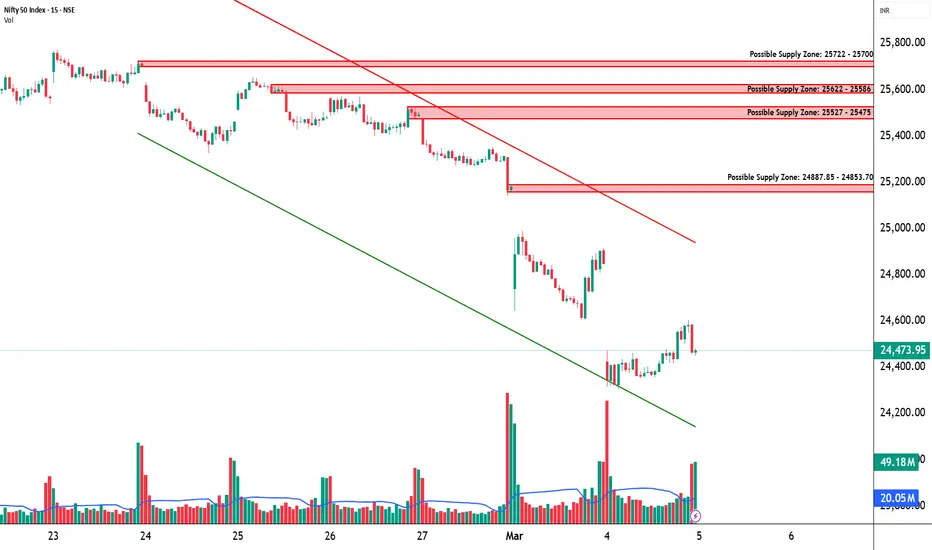
📊 Nifty Analysis for 05th March 2026
(Simple Chart Reading)
CMP: 24,480
Current Structure: Downtrend on daily chart with price trading below recent range
Market Mood: Bearish bias with short-term bounce attempts
Nifty continues to trade below previous support zones after the recent breakdown. The daily structure shows lower highs and expanding volatility, suggesting selling pressure remains active. Immediate resistance is placed near 24,620, followed by 24,759 and 24,917. Stronger supply remains positioned higher near 25,622–25,586 and around the swing high zone near 25,650. On the downside, immediate support is placed near 24,323, followed by 24,165 and 24,026. The recent bounce from the 24,305 swing low on the intraday chart indicates short-term recovery attempts within the broader weak structure.
For intraday reference, support levels are 24,323, 24,165 and 24,026. Resistance levels are 24,620, 24,759 and 24,917. The immediate supply zone is around 24,887–24,853 where earlier breakdown occurred, while stronger resistance remains near 25,622–25,586.
If the market opens with a gap up within about a 100-point range, price may initially attempt to move towards 24,620. If buying strength continues, it may extend towards 24,759. However, selling pressure may appear near 24,620–24,759, and stronger rejection may occur near 24,887–24,853. If price falls after a gap-up open, it may drift back towards 24,480, then towards 24,323, and if weakness increases, towards 24,165.
If the market opens with a gap down within roughly a 100-point range, price may first test the support area near 24,323. If selling pressure continues, it may extend towards 24,165 and possibly 24,026. A bounce may begin from these lower support areas. If price rises after a gap-down open, it may first move back towards 24,480, then towards 24,620, where resistance behaviour can appear.
In case of a sideways or range-bound session, price may oscillate between 24,323 and 24,620 as the immediate range. An extended range may stretch between 24,165 and 24,759. Inside this band, price may continue moving between support and resistance, and breakouts may need strong participation to sustain.
Observationally, if price sustains above 24,917, higher reference zones may appear near 25,200 and 25,500 where reaction behaviour can be monitored. On the downside, if price slips below 24,026, further reference areas may appear near 23,800 and 23,500 where support behaviour may develop.
Overall, the daily chart structure remains weak below 24,759–24,917. Immediate support lies near 24,323–24,165, while stronger supply remains positioned above 24,887 and again near 25,600. A larger directional move may develop once price clearly moves beyond this broader range.
STWP View: The market continues to show weakness below 24,759. Upside possibilities may improve only if price sustains above 24,917. Downside pressure may increase below 24,323–24,165. The early part of the session may provide clues whether the bounce continues or selling resumes.
⚠️ Disclaimer
This post is intended solely for educational and informational purposes. It does not constitute investment advice, a recommendation, or a solicitation to buy or sell any security. Market investments are subject to risk. Please consult a SEBI-registered financial advisor before making any investment decisions. STWP is not responsible for actions taken based on this analysis.
(Simple Chart Reading)
CMP: 24,480
Current Structure: Downtrend on daily chart with price trading below recent range
Market Mood: Bearish bias with short-term bounce attempts
Nifty continues to trade below previous support zones after the recent breakdown. The daily structure shows lower highs and expanding volatility, suggesting selling pressure remains active. Immediate resistance is placed near 24,620, followed by 24,759 and 24,917. Stronger supply remains positioned higher near 25,622–25,586 and around the swing high zone near 25,650. On the downside, immediate support is placed near 24,323, followed by 24,165 and 24,026. The recent bounce from the 24,305 swing low on the intraday chart indicates short-term recovery attempts within the broader weak structure.
For intraday reference, support levels are 24,323, 24,165 and 24,026. Resistance levels are 24,620, 24,759 and 24,917. The immediate supply zone is around 24,887–24,853 where earlier breakdown occurred, while stronger resistance remains near 25,622–25,586.
If the market opens with a gap up within about a 100-point range, price may initially attempt to move towards 24,620. If buying strength continues, it may extend towards 24,759. However, selling pressure may appear near 24,620–24,759, and stronger rejection may occur near 24,887–24,853. If price falls after a gap-up open, it may drift back towards 24,480, then towards 24,323, and if weakness increases, towards 24,165.
If the market opens with a gap down within roughly a 100-point range, price may first test the support area near 24,323. If selling pressure continues, it may extend towards 24,165 and possibly 24,026. A bounce may begin from these lower support areas. If price rises after a gap-down open, it may first move back towards 24,480, then towards 24,620, where resistance behaviour can appear.
In case of a sideways or range-bound session, price may oscillate between 24,323 and 24,620 as the immediate range. An extended range may stretch between 24,165 and 24,759. Inside this band, price may continue moving between support and resistance, and breakouts may need strong participation to sustain.
Observationally, if price sustains above 24,917, higher reference zones may appear near 25,200 and 25,500 where reaction behaviour can be monitored. On the downside, if price slips below 24,026, further reference areas may appear near 23,800 and 23,500 where support behaviour may develop.
Overall, the daily chart structure remains weak below 24,759–24,917. Immediate support lies near 24,323–24,165, while stronger supply remains positioned above 24,887 and again near 25,600. A larger directional move may develop once price clearly moves beyond this broader range.
STWP View: The market continues to show weakness below 24,759. Upside possibilities may improve only if price sustains above 24,917. Downside pressure may increase below 24,323–24,165. The early part of the session may provide clues whether the bounce continues or selling resumes.
⚠️ Disclaimer
This post is intended solely for educational and informational purposes. It does not constitute investment advice, a recommendation, or a solicitation to buy or sell any security. Market investments are subject to risk. Please consult a SEBI-registered financial advisor before making any investment decisions. STWP is not responsible for actions taken based on this analysis.

STWP | Mentor & Demand-Supply Specialist |
Empowering traders through structured learning |
simpletradewithpatience.com
Community: chat.whatsapp.com/BEYz0tkqP0fJPBCWf59uel
wa.me/message/6IOPHGOXMGZ4N1
Educational Only
Empowering traders through structured learning |
simpletradewithpatience.com
Community: chat.whatsapp.com/BEYz0tkqP0fJPBCWf59uel
wa.me/message/6IOPHGOXMGZ4N1
Educational Only
Clause de non-responsabilité
Les informations et publications ne sont pas destinées à être, et ne constituent pas, des conseils ou recommandations financiers, d'investissement, de trading ou autres fournis ou approuvés par TradingView. Pour en savoir plus, consultez les Conditions d'utilisation.
STWP | Mentor & Demand-Supply Specialist |
Empowering traders through structured learning |
simpletradewithpatience.com
Community: chat.whatsapp.com/BEYz0tkqP0fJPBCWf59uel
wa.me/message/6IOPHGOXMGZ4N1
Educational Only
Empowering traders through structured learning |
simpletradewithpatience.com
Community: chat.whatsapp.com/BEYz0tkqP0fJPBCWf59uel
wa.me/message/6IOPHGOXMGZ4N1
Educational Only
Clause de non-responsabilité
Les informations et publications ne sont pas destinées à être, et ne constituent pas, des conseils ou recommandations financiers, d'investissement, de trading ou autres fournis ou approuvés par TradingView. Pour en savoir plus, consultez les Conditions d'utilisation.