
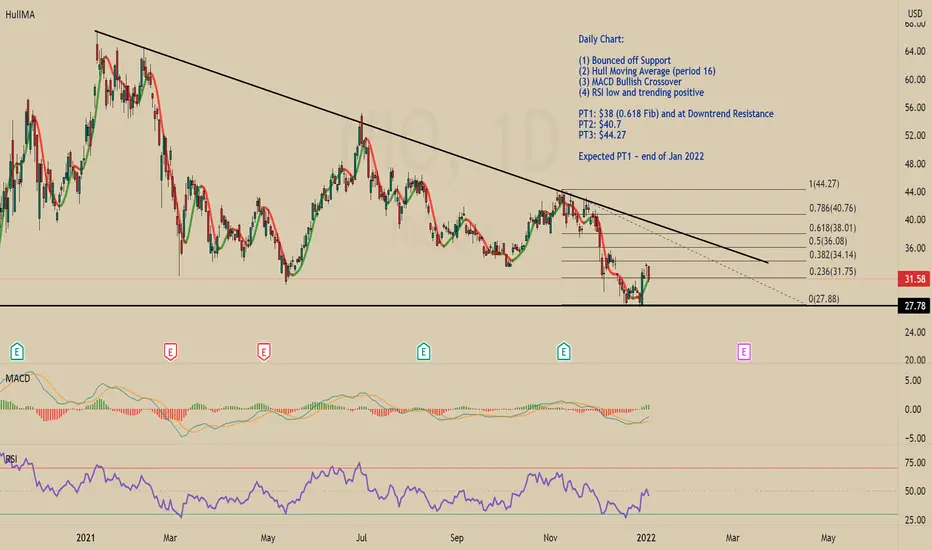
Justification and PTs provided on Chart.
Daily Chart:
(1) Bounced off Support
(2) Hull Moving Average (period 16)
(3) MACD Bullish Crossover
(4) RSI low and trending positive
PT1: $38 (0.618 Fib) and at Downtrend Resistance
PT2: $40.7
PT3: $44.27
Expected PT1 ~ end of Jan 2022
Daily Chart:
(1) Bounced off Support
(2) Hull Moving Average (period 16)
(3) MACD Bullish Crossover
(4) RSI low and trending positive
PT1: $38 (0.618 Fib) and at Downtrend Resistance
PT2: $40.7
PT3: $44.27
Expected PT1 ~ end of Jan 2022

Clause de non-responsabilité
Les informations et publications ne sont pas destinées à être, et ne constituent pas, des conseils ou recommandations financiers, d'investissement, de trading ou autres fournis ou approuvés par TradingView. Pour en savoir plus, consultez les Conditions d'utilisation.
Clause de non-responsabilité
Les informations et publications ne sont pas destinées à être, et ne constituent pas, des conseils ou recommandations financiers, d'investissement, de trading ou autres fournis ou approuvés par TradingView. Pour en savoir plus, consultez les Conditions d'utilisation.