
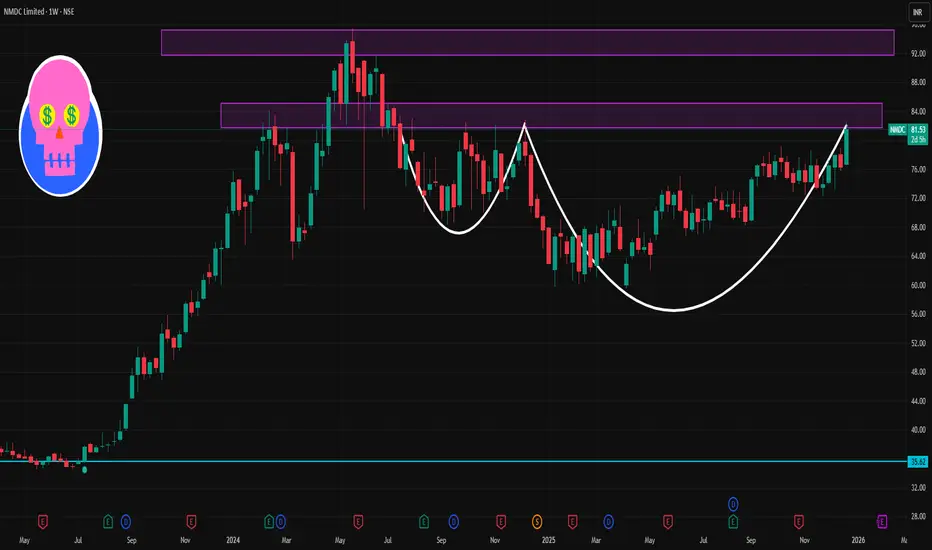
📊 Current Price Context
NMDC is trading around ₹81–₹82 on NSE currently.
📉 Weekly Support Levels
1. Primary Support: ~₹79–₹77 zone
Weekly pivot region and short‑term support clustered here.
2. Next Support: ~₹76–₹74 region
A key technical support band on weekly charts and potential “re‑entry” level if near‑term support breaks.
3. Lower Support Floor: ~₹69–₹68 (longer weekly support)
If the ₹74 region fails decisively, the next significant weekly demand zone is here.
📈 Weekly Resistance Levels
1. Immediate Resistance: ~₹82–₹83
Near the current trading range high and recent pivot resistance.
2. Higher Resistance: ~₹84–₹86
Represents a zone where weekly price has previously stalled.
3. Major Breakout Level: Above ₹88‑₹90
Crossing and closing above this weekly zone can signal stronger bullish continuation.
📌 Trading Tip:
Bullish view: Weekly close above ₹82–₹83 strengthens upside potential.
Bearish risk: Weekly break below ₹76–₹74 weakens structure and could target lower supports.
NMDC is trading around ₹81–₹82 on NSE currently.
📉 Weekly Support Levels
1. Primary Support: ~₹79–₹77 zone
Weekly pivot region and short‑term support clustered here.
2. Next Support: ~₹76–₹74 region
A key technical support band on weekly charts and potential “re‑entry” level if near‑term support breaks.
3. Lower Support Floor: ~₹69–₹68 (longer weekly support)
If the ₹74 region fails decisively, the next significant weekly demand zone is here.
📈 Weekly Resistance Levels
1. Immediate Resistance: ~₹82–₹83
Near the current trading range high and recent pivot resistance.
2. Higher Resistance: ~₹84–₹86
Represents a zone where weekly price has previously stalled.
3. Major Breakout Level: Above ₹88‑₹90
Crossing and closing above this weekly zone can signal stronger bullish continuation.
📌 Trading Tip:
Bullish view: Weekly close above ₹82–₹83 strengthens upside potential.
Bearish risk: Weekly break below ₹76–₹74 weakens structure and could target lower supports.

Contact Knowledgehub for a detailed consultation: Dm on WhatsApp: [wa.link/a2o0kz]-
Phone No: [+91 93102 26243]-
Email: [tradingviewknowledgehub@gmail.com]---
-- Let’s achieve success together!
Phone No: [+91 93102 26243]-
Email: [tradingviewknowledgehub@gmail.com]---
-- Let’s achieve success together!
Publications connexes
Clause de non-responsabilité
Les informations et publications ne sont pas destinées à être, et ne constituent pas, des conseils ou recommandations financiers, d'investissement, de trading ou autres fournis ou approuvés par TradingView. Pour en savoir plus, consultez les Conditions d'utilisation.
Contact Knowledgehub for a detailed consultation: Dm on WhatsApp: [wa.link/a2o0kz]-
Phone No: [+91 93102 26243]-
Email: [tradingviewknowledgehub@gmail.com]---
-- Let’s achieve success together!
Phone No: [+91 93102 26243]-
Email: [tradingviewknowledgehub@gmail.com]---
-- Let’s achieve success together!
Publications connexes
Clause de non-responsabilité
Les informations et publications ne sont pas destinées à être, et ne constituent pas, des conseils ou recommandations financiers, d'investissement, de trading ou autres fournis ou approuvés par TradingView. Pour en savoir plus, consultez les Conditions d'utilisation.