
📌 Current Price Snapshot (Latest Market Data)
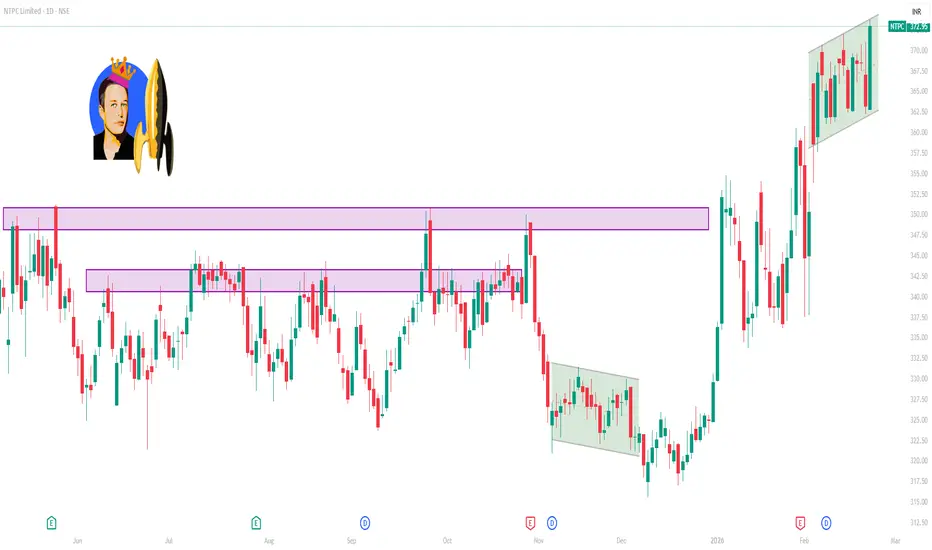
📈 NTPC’s share price has recently been trading around ₹372–₹374 on the NSE, continuing strength after recent gains and hitting near 52-week highs.
📊 Daily (1D) Technical Levels
These are derived from standard pivot point calculations and intraday technical data:
🔹 Pivot / Reference
• Daily Pivot: ~₹368.76 (central level where trading bias shifts)
🔸 Resistance Levels (Upside Targets)
R1: ~₹370.13
R2: ~₹372.01
R3: ~₹373.38 — near recent price highs
➡ If the stock stays above the pivot (~368–369) and breaches R2/R3, upside momentum may sustain during the session.
🔹 Support Levels (Downside Zones)
S1: ~₹366.88
S2: ~₹365.51
S3: ~₹363.63 — deeper intraday support
➡ Below the Pivot (~368) and especially below S2/S3, intraday weakness or pullback risks increase.
🧠 Indicator Snapshot (Short-Term Bias)
RSI (14): ~63.9 — generally neutral-to-mild bullish territory.
MACD: slightly bearish signal recently.
This mixed indicator picture suggests momentum is present but not deeply overbought, so watch price action around the pivot and first resistance/support zones closely.
📉 Moving Average Context
Key moving averages near current prices also act as dynamic support/resistance:
10D SMA ~367, 20D ~361, 50D ~345 — all below current price, indicating short-term bullish structure.
📈 NTPC’s share price has recently been trading around ₹372–₹374 on the NSE, continuing strength after recent gains and hitting near 52-week highs.
📊 Daily (1D) Technical Levels
These are derived from standard pivot point calculations and intraday technical data:
🔹 Pivot / Reference
• Daily Pivot: ~₹368.76 (central level where trading bias shifts)
🔸 Resistance Levels (Upside Targets)
R1: ~₹370.13
R2: ~₹372.01
R3: ~₹373.38 — near recent price highs
➡ If the stock stays above the pivot (~368–369) and breaches R2/R3, upside momentum may sustain during the session.
🔹 Support Levels (Downside Zones)
S1: ~₹366.88
S2: ~₹365.51
S3: ~₹363.63 — deeper intraday support
➡ Below the Pivot (~368) and especially below S2/S3, intraday weakness or pullback risks increase.
🧠 Indicator Snapshot (Short-Term Bias)
RSI (14): ~63.9 — generally neutral-to-mild bullish territory.
MACD: slightly bearish signal recently.
This mixed indicator picture suggests momentum is present but not deeply overbought, so watch price action around the pivot and first resistance/support zones closely.
📉 Moving Average Context
Key moving averages near current prices also act as dynamic support/resistance:
10D SMA ~367, 20D ~361, 50D ~345 — all below current price, indicating short-term bullish structure.

Contact Knowledgehub for a detailed consultation: Dm on WhatsApp: [wa.link/a2o0kz]-
Phone No: [+91 93102 26243]-
Email: [tradingviewknowledgehub@gmail.com]---
-- Let’s achieve success together!
Phone No: [+91 93102 26243]-
Email: [tradingviewknowledgehub@gmail.com]---
-- Let’s achieve success together!
Publications connexes
Clause de non-responsabilité
Les informations et publications ne sont pas destinées à être, et ne constituent pas, des conseils ou recommandations financiers, d'investissement, de trading ou autres fournis ou approuvés par TradingView. Pour en savoir plus, consultez les Conditions d'utilisation.
Contact Knowledgehub for a detailed consultation: Dm on WhatsApp: [wa.link/a2o0kz]-
Phone No: [+91 93102 26243]-
Email: [tradingviewknowledgehub@gmail.com]---
-- Let’s achieve success together!
Phone No: [+91 93102 26243]-
Email: [tradingviewknowledgehub@gmail.com]---
-- Let’s achieve success together!
Publications connexes
Clause de non-responsabilité
Les informations et publications ne sont pas destinées à être, et ne constituent pas, des conseils ou recommandations financiers, d'investissement, de trading ou autres fournis ou approuvés par TradingView. Pour en savoir plus, consultez les Conditions d'utilisation.