
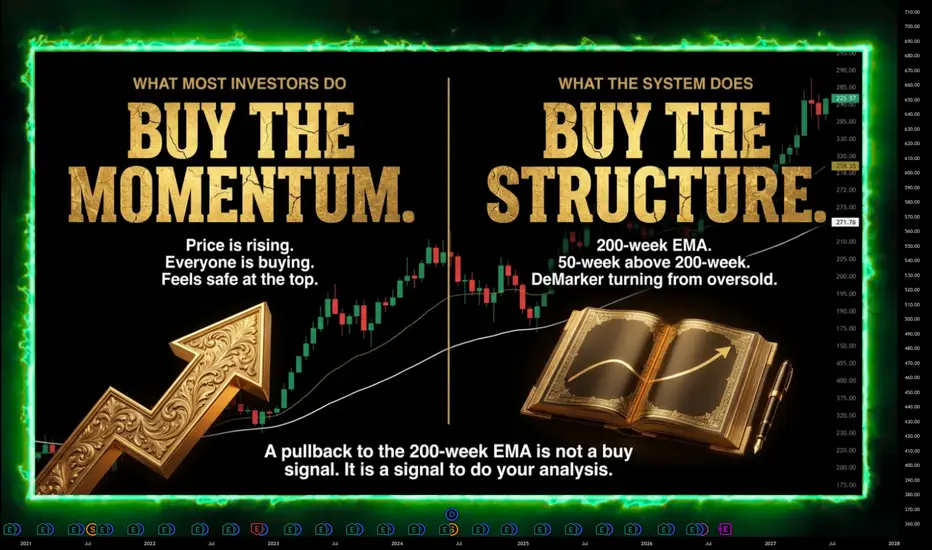
GLD closed the long-term 200-week EMA position for 124% total return as price pulled back from the $509.70 high. The exit was mechanical, the trailing stop below the 50-week EMA triggered on a sustained weekly close below that level. No prediction of the top required.
The system that produced this result has three conditions that must all be simultaneously true before any accumulation begins.
The 50-week EMA must be above the 200-week EMA. The trend must be intact. Without this, no position opens regardless of how cheap the asset looks.
Price must pull into the 200-week EMA zone. Not any pullback. A structural pullback to the long-term average cost basis level where patient capital has historically stepped in.
The DeMarker on the weekly must drop below 0.3 and begin turning upward. Both conditions. Not just oversold. Turning up from oversold.
On the annotated GLD chart, the four numbered steps show this working in real time. Step 1 is the accumulation zone. Step 2 is the DeMarker rising from oversold. Step 3 is the 50-week EMA trail throughout the hold. Step 4 is the 124% close.
The current GLD chart shows the yellow circle on the DeMarker at its lowest reading since the original 2023 accumulation zone. The 50-week EMA has been broken by the current pullback. The note on the chart is accurate: accumulation will start again if it pushes lower and the DeMarker flips bullish again after trading closer to the 200-week EMA. The 200-week EMA zone currently sits in the $284 to $300 area on GLD. Two of the three conditions are forming. The third is not yet confirmed.
A pullback to the 200-week EMA is not a buy signal. It is a signal to watch. The DeMarker confirmation is the entry trigger.
Apply the same framework to the NVDA chart. Two prior 200-week EMA entries. 86% in 2019. 716% in the 2022 to 2025 cycle. Current price around $210, pulling back from the $236.54 all-time high. The 200-week EMA is well below current price. No accumulation signal yet. The system watches and waits.
Not financial advice. All levels are for analytical purposes only.
The system that produced this result has three conditions that must all be simultaneously true before any accumulation begins.
The 50-week EMA must be above the 200-week EMA. The trend must be intact. Without this, no position opens regardless of how cheap the asset looks.
Price must pull into the 200-week EMA zone. Not any pullback. A structural pullback to the long-term average cost basis level where patient capital has historically stepped in.
The DeMarker on the weekly must drop below 0.3 and begin turning upward. Both conditions. Not just oversold. Turning up from oversold.
On the annotated GLD chart, the four numbered steps show this working in real time. Step 1 is the accumulation zone. Step 2 is the DeMarker rising from oversold. Step 3 is the 50-week EMA trail throughout the hold. Step 4 is the 124% close.
The current GLD chart shows the yellow circle on the DeMarker at its lowest reading since the original 2023 accumulation zone. The 50-week EMA has been broken by the current pullback. The note on the chart is accurate: accumulation will start again if it pushes lower and the DeMarker flips bullish again after trading closer to the 200-week EMA. The 200-week EMA zone currently sits in the $284 to $300 area on GLD. Two of the three conditions are forming. The third is not yet confirmed.
A pullback to the 200-week EMA is not a buy signal. It is a signal to watch. The DeMarker confirmation is the entry trigger.
Apply the same framework to the NVDA chart. Two prior 200-week EMA entries. 86% in 2019. 716% in the 2022 to 2025 cycle. Current price around $210, pulling back from the $236.54 all-time high. The 200-week EMA is well below current price. No accumulation signal yet. The system watches and waits.
Not financial advice. All levels are for analytical purposes only.

⭐ Follow the 3-Gate System - tradedesk.rbtrading.site
⭐ Prop Firm Deals - linktr.ee/rb_tradingltd
⭐ #1 Free Trading Journal Lite | +20% Off Pro code RBT20 - rbtrading.site/?ref=RBT20
⭐ Prop Firm Deals - linktr.ee/rb_tradingltd
⭐ #1 Free Trading Journal Lite | +20% Off Pro code RBT20 - rbtrading.site/?ref=RBT20
Clause de non-responsabilité
Les informations et publications ne sont pas destinées à être, et ne constituent pas, des conseils ou recommandations financiers, d'investissement, de trading ou autres fournis ou approuvés par TradingView. Pour en savoir plus, consultez les Conditions d'utilisation.
⭐ Follow the 3-Gate System - tradedesk.rbtrading.site
⭐ Prop Firm Deals - linktr.ee/rb_tradingltd
⭐ #1 Free Trading Journal Lite | +20% Off Pro code RBT20 - rbtrading.site/?ref=RBT20
⭐ Prop Firm Deals - linktr.ee/rb_tradingltd
⭐ #1 Free Trading Journal Lite | +20% Off Pro code RBT20 - rbtrading.site/?ref=RBT20
Clause de non-responsabilité
Les informations et publications ne sont pas destinées à être, et ne constituent pas, des conseils ou recommandations financiers, d'investissement, de trading ou autres fournis ou approuvés par TradingView. Pour en savoir plus, consultez les Conditions d'utilisation.