
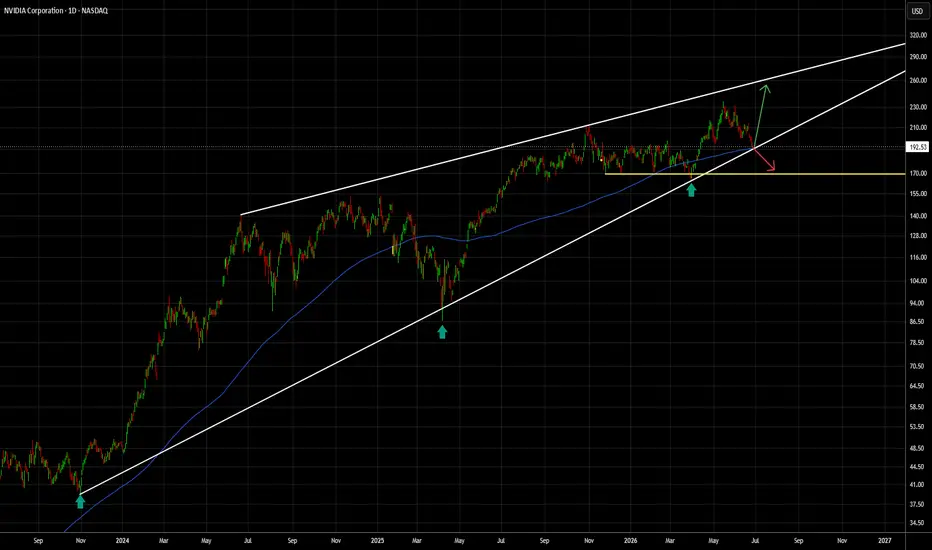
NVDA is approaching a significant technical decision area, currently about to test a trendline that has held strong support multiple times since October 2023.
The broader structure is a rising wedge, a pattern that tends to resolve with a bearish breakdown.
Adding more significance to this area, the 200-day moving average is sitting almost exactly at the bottom of the trendline around $190.64, creating another strong technical support zone.
Bullish scenario:
If NVDA manages to hold the trendline and the 200 MA, this could trigger a bounce from the support area. The upside target would be a move back toward the upper trendline, the “ceiling” of the wedge structure.
Bearish scenario:
A confirmed breakdown below the trendline and 200 MA would invalidate this support zone. The breakdown does not necessarily have to happen immediately, price could consolidate around this area first. If support fails, the next major support level sits around $170.
This is a key area where buyers need to defend support, otherwise the rising wedge setup could start playing out.
The broader structure is a rising wedge, a pattern that tends to resolve with a bearish breakdown.
Adding more significance to this area, the 200-day moving average is sitting almost exactly at the bottom of the trendline around $190.64, creating another strong technical support zone.
Bullish scenario:
If NVDA manages to hold the trendline and the 200 MA, this could trigger a bounce from the support area. The upside target would be a move back toward the upper trendline, the “ceiling” of the wedge structure.
Bearish scenario:
A confirmed breakdown below the trendline and 200 MA would invalidate this support zone. The breakdown does not necessarily have to happen immediately, price could consolidate around this area first. If support fails, the next major support level sits around $170.
This is a key area where buyers need to defend support, otherwise the rising wedge setup could start playing out.

Clause de non-responsabilité
Les informations et publications ne sont pas destinées à être, et ne constituent pas, des conseils ou recommandations financiers, d'investissement, de trading ou autres fournis ou approuvés par TradingView. Pour en savoir plus, consultez les Conditions d'utilisation.
Clause de non-responsabilité
Les informations et publications ne sont pas destinées à être, et ne constituent pas, des conseils ou recommandations financiers, d'investissement, de trading ou autres fournis ou approuvés par TradingView. Pour en savoir plus, consultez les Conditions d'utilisation.