
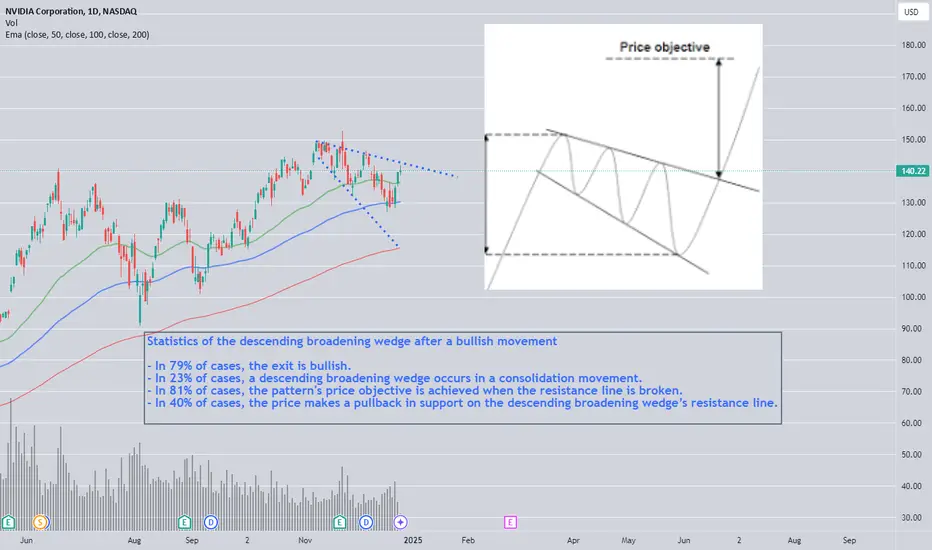
The stocks is placing a bullish pattern
Descending broadening wedge
CASE 1: formation of a descending broadening wedge after a trough
This type of pattern appears on the troughs, it is a bullish reversal pattern.
The break in the resistance line definitively validates the pattern.
The price objective is determined by the highest point at which the descending broadening wedge was formed.
NB: often, the steeper the descending broadening wedge’s trend lines, the faster the price objective is reached.
Statistics of the descending broadening wedge after a bullish movement
In 80% of cases, the exit is bullish.
In 75% of cases, a descending broadening wedge is a reversal pattern.
In 60% of cases, a descending broadening wedge’s price objective is achieved when the resistance line is broken.
In 21% of cases, the price makes a pullback in support on the descending broadening wedge’s resistance line.

Mark Minervini VCP Complete Guide
youtu.be/KzEJsqbAmB0
Follow my X profile for FREE proitable trading setups!
x.com/Khalaf_stocks
youtu.be/KzEJsqbAmB0
Follow my X profile for FREE proitable trading setups!
x.com/Khalaf_stocks
Clause de non-responsabilité
Les informations et publications ne sont pas destinées à être, et ne constituent pas, des conseils ou recommandations financiers, d'investissement, de trading ou autres fournis ou approuvés par TradingView. Pour en savoir plus, consultez les Conditions d'utilisation.