
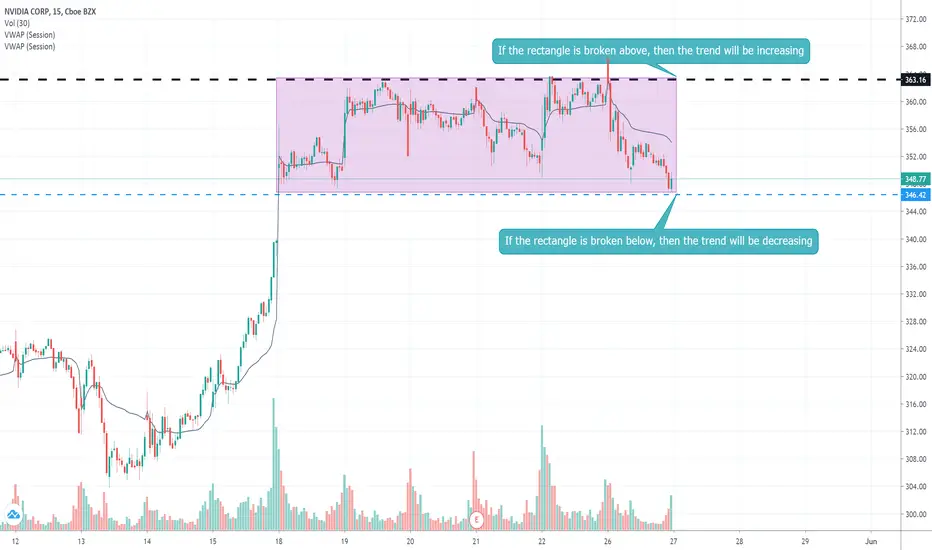
As shown in the graph, it seems there is an equilibrium during a certain period (Period specified by the rectangle.
Any huge break of this rectangle gives an idea about the trend of the stock price. if it breaks it down, the stock has a good chance to b decreasing, however, if it an up break, the stock will be increasing.
If none of these cases were realized, the NVIDIA stock will continue its equilibrium.
Any huge break of this rectangle gives an idea about the trend of the stock price. if it breaks it down, the stock has a good chance to b decreasing, however, if it an up break, the stock will be increasing.
If none of these cases were realized, the NVIDIA stock will continue its equilibrium.

Clause de non-responsabilité
Les informations et publications ne sont pas destinées à être, et ne constituent pas, des conseils ou recommandations financiers, d'investissement, de trading ou autres fournis ou approuvés par TradingView. Pour en savoir plus, consultez les Conditions d'utilisation.
Clause de non-responsabilité
Les informations et publications ne sont pas destinées à être, et ne constituent pas, des conseils ou recommandations financiers, d'investissement, de trading ou autres fournis ou approuvés par TradingView. Pour en savoir plus, consultez les Conditions d'utilisation.