
While headlines scream "bubble" and Michael Burry loads up on short positions, I’m doubling down on what the charts are actually saying — not the fear-based narratives. This post is for those who trust price structure, volume psychology, and timeframe alignment over media noise. Let’s dive in.
Chart Structure Speaks Louder Than Opinions
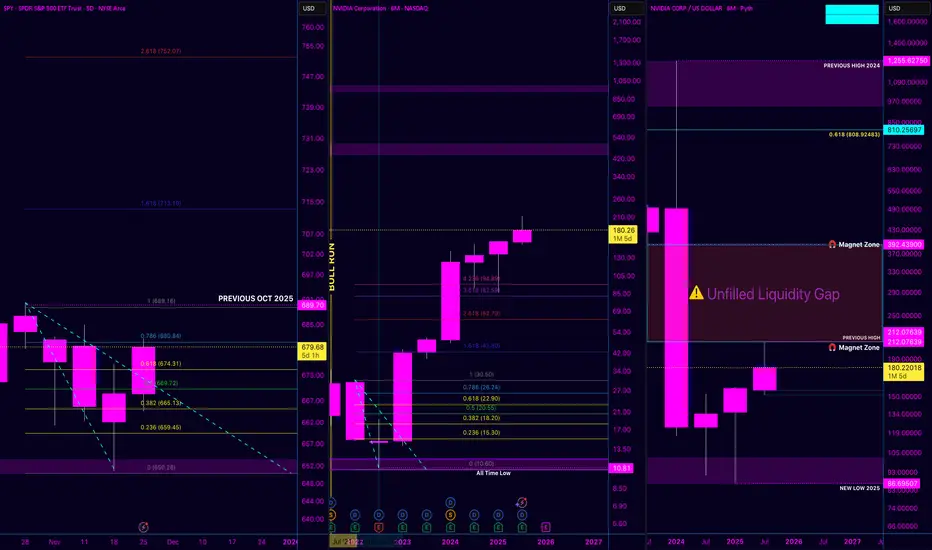
Across all timeframes — from 4H to 6M — NVDA and the broader S&P are forming morning star dojis, a powerful reversal signal. These candles are whispering accumulation. Retail isn’t listening. Smart money already has.
Key Observations:
SPY & SPXL (S&P 500 ETFs): Forming higher lows with bullish fib retracements holding tight. No sign of weakness, despite Burry’s apocalyptic tone.
NVDA (NASDAQ):
The 6M chart shows clear magnet zones at 212 and 392.
An unfilled liquidity gap from the 390s is now acting as a gravitational pull — price will revisit it.
Every timeframe confirms this momentum is building for a breakout, not breakdown.
NVDA/USD Confluence: Mirrors the NVDA/NASDAQ structure almost 1:1. This correlation across instruments adds major conviction to the thesis.
Psychology Check: Why I Disagree with Michael Burry
Burry may be shorting because of macroeconomic risk. Or, maybe he’s playing the same game Melvin Capital did — betting retail will panic.
But I believe he’s underestimating the AI revolution, semiconductor demand, and the market’s memory of missed upside in prior decades.
The dot-com boom had hype, yes — but this has utility. AI isn’t a buzzword anymore. It’s infrastructure. And NVDA is at the core.
Liquidity will return. The market will wake up. And those who held the line will reap the rewards.
Final Words:
The media lies. Liquidity hides. But candlesticks don’t fake structure.
If NVDA fills its liquidity magnet, hits prior highs, or simply rides the S&P's tide — the upside is mathematically undeniable.
To those holding — congratulations.
To the bears — good luck.
To Burry — you might be early, but you might also be wrong.
- MoNí
Chart Structure Speaks Louder Than Opinions
Across all timeframes — from 4H to 6M — NVDA and the broader S&P are forming morning star dojis, a powerful reversal signal. These candles are whispering accumulation. Retail isn’t listening. Smart money already has.
Key Observations:
SPY & SPXL (S&P 500 ETFs): Forming higher lows with bullish fib retracements holding tight. No sign of weakness, despite Burry’s apocalyptic tone.
NVDA (NASDAQ):
The 6M chart shows clear magnet zones at 212 and 392.
An unfilled liquidity gap from the 390s is now acting as a gravitational pull — price will revisit it.
Every timeframe confirms this momentum is building for a breakout, not breakdown.
NVDA/USD Confluence: Mirrors the NVDA/NASDAQ structure almost 1:1. This correlation across instruments adds major conviction to the thesis.
Psychology Check: Why I Disagree with Michael Burry
Burry may be shorting because of macroeconomic risk. Or, maybe he’s playing the same game Melvin Capital did — betting retail will panic.
But I believe he’s underestimating the AI revolution, semiconductor demand, and the market’s memory of missed upside in prior decades.
The dot-com boom had hype, yes — but this has utility. AI isn’t a buzzword anymore. It’s infrastructure. And NVDA is at the core.
Liquidity will return. The market will wake up. And those who held the line will reap the rewards.
Final Words:
The media lies. Liquidity hides. But candlesticks don’t fake structure.
If NVDA fills its liquidity magnet, hits prior highs, or simply rides the S&P's tide — the upside is mathematically undeniable.
To those holding — congratulations.
To the bears — good luck.
To Burry — you might be early, but you might also be wrong.
- MoNí

Publications connexes
Clause de non-responsabilité
Les informations et publications ne sont pas destinées à être, et ne constituent pas, des conseils ou recommandations financiers, d'investissement, de trading ou autres fournis ou approuvés par TradingView. Pour en savoir plus, consultez les Conditions d'utilisation.
Publications connexes
Clause de non-responsabilité
Les informations et publications ne sont pas destinées à être, et ne constituent pas, des conseils ou recommandations financiers, d'investissement, de trading ou autres fournis ou approuvés par TradingView. Pour en savoir plus, consultez les Conditions d'utilisation.