
## NASDAQ: NVDA — Rectangle Breakout & Throwback Test
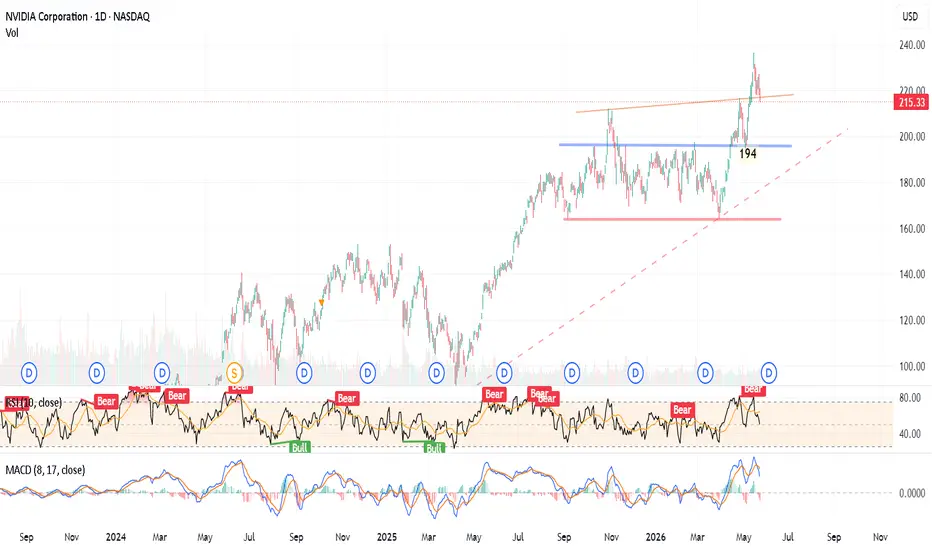
**NVIDIA Corporation (NVDA)** has broken out of a massive multi-month rectangle consolidation zone on the daily chart and is currently executing a standard technical throwback to validate old resistance as new support.
---
### Setup Breakdown
* **The Range:** For months, the price fluctuated inside a massive horizontal rectangle bounds, capped by a firm resistance ceiling at **194 USD** (blue line) and a solid floor near **162 USD** (pink line).
* **The Breakout & Peak:** Price explosively cleared the **194 USD** barrier, rallying to print a fresh local high just under the minor upper resistance trendline (orange line).
* **The Throwback:** The stock is currently pulling back to **215.33 USD**, heading down to test the major breakout structural level at **194 USD** alongside the macro ascending support trendline (dashed red line).
---
### Indicators
* **RSI (10):** Dropped to **50.24** from the overbought "Bear" zone, successfully cooling down structural extensions and stabilizing at the neutral midline.
* **MACD (8, 17):** Displaying a short-term bearish crossover above the zero line, confirming a healthy, corrective pullback rather than structural distribution.
---
### Action Plan
* **Trigger:** Buy on confirmed daily price rejection (e.g., pin bar or engulfing candle) at the **194 USD** horizontal shelf.
* **Targets:** **225 USD** $\rightarrow$ **240 USD** (testing the upper trendline target).
* **Stop Loss:** A daily close below **188 USD** breaks back inside the old range and invalidates the immediate throwback setup.
**NVIDIA Corporation (NVDA)** has broken out of a massive multi-month rectangle consolidation zone on the daily chart and is currently executing a standard technical throwback to validate old resistance as new support.
---
### Setup Breakdown
* **The Range:** For months, the price fluctuated inside a massive horizontal rectangle bounds, capped by a firm resistance ceiling at **194 USD** (blue line) and a solid floor near **162 USD** (pink line).
* **The Breakout & Peak:** Price explosively cleared the **194 USD** barrier, rallying to print a fresh local high just under the minor upper resistance trendline (orange line).
* **The Throwback:** The stock is currently pulling back to **215.33 USD**, heading down to test the major breakout structural level at **194 USD** alongside the macro ascending support trendline (dashed red line).
---
### Indicators
* **RSI (10):** Dropped to **50.24** from the overbought "Bear" zone, successfully cooling down structural extensions and stabilizing at the neutral midline.
* **MACD (8, 17):** Displaying a short-term bearish crossover above the zero line, confirming a healthy, corrective pullback rather than structural distribution.
---
### Action Plan
* **Trigger:** Buy on confirmed daily price rejection (e.g., pin bar or engulfing candle) at the **194 USD** horizontal shelf.
* **Targets:** **225 USD** $\rightarrow$ **240 USD** (testing the upper trendline target).
* **Stop Loss:** A daily close below **188 USD** breaks back inside the old range and invalidates the immediate throwback setup.

Clause de non-responsabilité
Les informations et publications ne sont pas destinées à être, et ne constituent pas, des conseils ou recommandations financiers, d'investissement, de trading ou autres fournis ou approuvés par TradingView. Pour en savoir plus, consultez les Conditions d'utilisation.
Clause de non-responsabilité
Les informations et publications ne sont pas destinées à être, et ne constituent pas, des conseils ou recommandations financiers, d'investissement, de trading ou autres fournis ou approuvés par TradingView. Pour en savoir plus, consultez les Conditions d'utilisation.