
Highest-probability setups often occur when multiple technical factors align at the same price level.
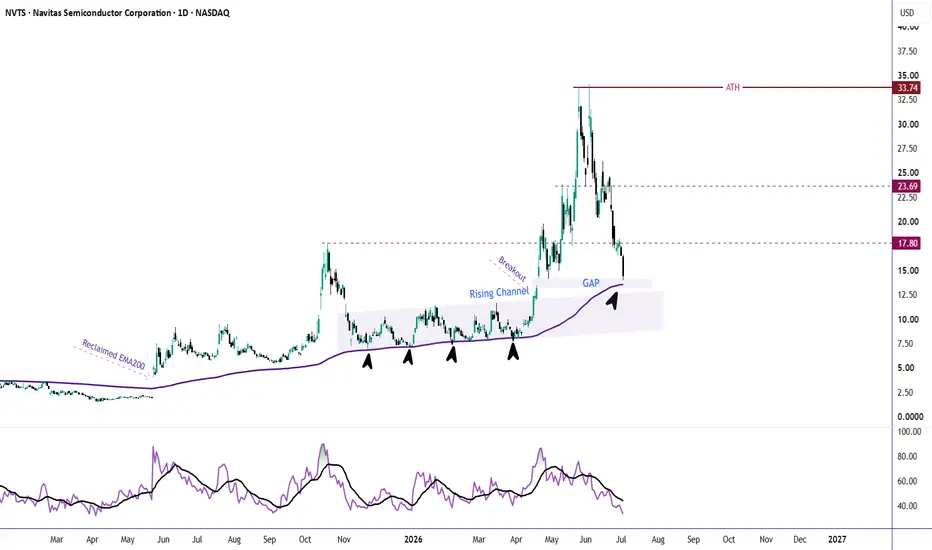
NVTS is currently approaching one of those areas.
Here's why the $12–14 zone deserves attention:
✅ 200-Day EMA – The stock has respected its 200-day EMA throughout the recent uptrend, making it an important dynamic support.
✅ Gap Fill – Price is revisiting a gap left below $14, a level that has already acted as support once before.
✅ Breakout Retest – If the decline continues, the previous breakout level near $12 could be retested. Successful breakout retests often provide strong continuation opportunities.
None of these signals alone guarantees a reversal.
However, when several technical factors converge in the same area, that zone becomes worth monitoring much more closely.
The key lesson is this:
Don't buy because price reaches support. Buy because buyers prove they are defending that support.
Look for confirmation such as:
Bullish reversal candlesticks
Increasing buying volume
Momentum shifting back to the bulls, Bullish divergence being formed.
Patience often outperforms prediction. Let the market confirm the setup before committing capital.
Remember: Great traders don't chase price—they wait for high-conviction locations where multiple technical factors align.
NVTS is currently approaching one of those areas.
Here's why the $12–14 zone deserves attention:
✅ 200-Day EMA – The stock has respected its 200-day EMA throughout the recent uptrend, making it an important dynamic support.
✅ Gap Fill – Price is revisiting a gap left below $14, a level that has already acted as support once before.
✅ Breakout Retest – If the decline continues, the previous breakout level near $12 could be retested. Successful breakout retests often provide strong continuation opportunities.
None of these signals alone guarantees a reversal.
However, when several technical factors converge in the same area, that zone becomes worth monitoring much more closely.
The key lesson is this:
Don't buy because price reaches support. Buy because buyers prove they are defending that support.
Look for confirmation such as:
Bullish reversal candlesticks
Increasing buying volume
Momentum shifting back to the bulls, Bullish divergence being formed.
Patience often outperforms prediction. Let the market confirm the setup before committing capital.
Remember: Great traders don't chase price—they wait for high-conviction locations where multiple technical factors align.
Note
here we are, the moment of truth, the first touch of EMA200
📊 Charts → 🏗️ Structure → 🎯 Probability =📖 Chart Story
⏳ Patience → 🚀Success
🎯 If this setup makes sense to you, show it some support with a Boost.
⏳ Patience → 🚀Success
🎯 If this setup makes sense to you, show it some support with a Boost.
Publications connexes
Clause de non-responsabilité
Les informations et publications ne sont pas destinées à être, et ne constituent pas, des conseils ou recommandations financiers, d'investissement, de trading ou autres fournis ou approuvés par TradingView. Pour en savoir plus, consultez les Conditions d'utilisation.
📊 Charts → 🏗️ Structure → 🎯 Probability =📖 Chart Story
⏳ Patience → 🚀Success
🎯 If this setup makes sense to you, show it some support with a Boost.
⏳ Patience → 🚀Success
🎯 If this setup makes sense to you, show it some support with a Boost.
Publications connexes
Clause de non-responsabilité
Les informations et publications ne sont pas destinées à être, et ne constituent pas, des conseils ou recommandations financiers, d'investissement, de trading ou autres fournis ou approuvés par TradingView. Pour en savoir plus, consultez les Conditions d'utilisation.