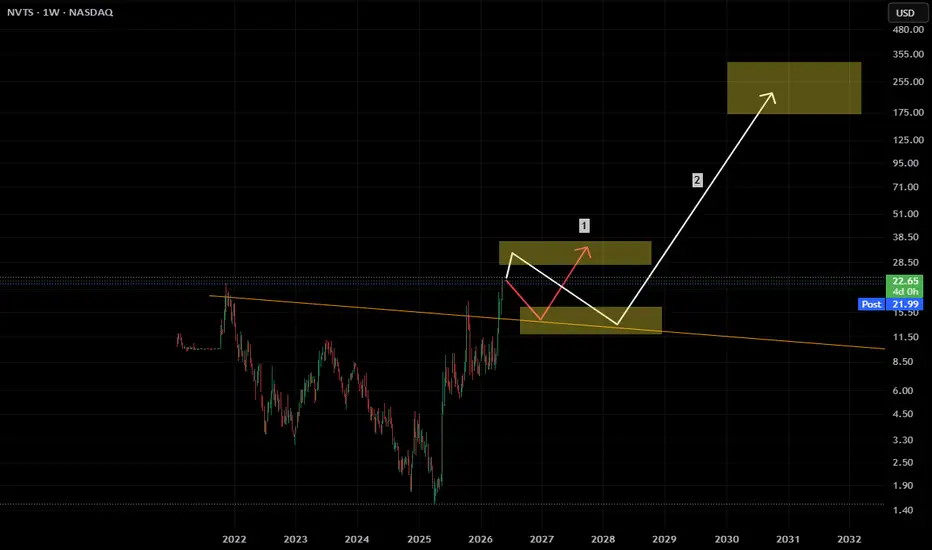
 NVTS : NASDAQ , Weekly
Multi-year base forming after a brutal drawdown from the 2021 highs. Price broke above a long-term descending resistance line in early 2026, the first meaningful structural shift in years.
The chart shows two key phases:
Phase 1 - A potential retest of the breakout zone and the trendline. This is where the thesis gets confirmed or rejected. Holding here matters.
Phase 2 - If the retest holds and a second leg develops, price would be targeting the historical supply zone from the 2021 breakdown, a level that would take significant time and volume to work through.
This is a long-duration idea. The base took years to build. The expansion, if it comes, will not be overnight.
No entries. No targets. Structural read only.
⚠️ Financial Disclaimer: This post is not financial advice. I am not your financial advisor, your life coach, or your legally responsible adult. Always do your own research and never trade based solely on internet comedy

Clause de non-responsabilité
Les informations et publications ne sont pas destinées à être, et ne constituent pas, des conseils ou recommandations financiers, d'investissement, de trading ou autres fournis ou approuvés par TradingView. Pour en savoir plus, consultez les Conditions d'utilisation.
Clause de non-responsabilité
Les informations et publications ne sont pas destinées à être, et ne constituent pas, des conseils ou recommandations financiers, d'investissement, de trading ou autres fournis ou approuvés par TradingView. Pour en savoir plus, consultez les Conditions d'utilisation.