

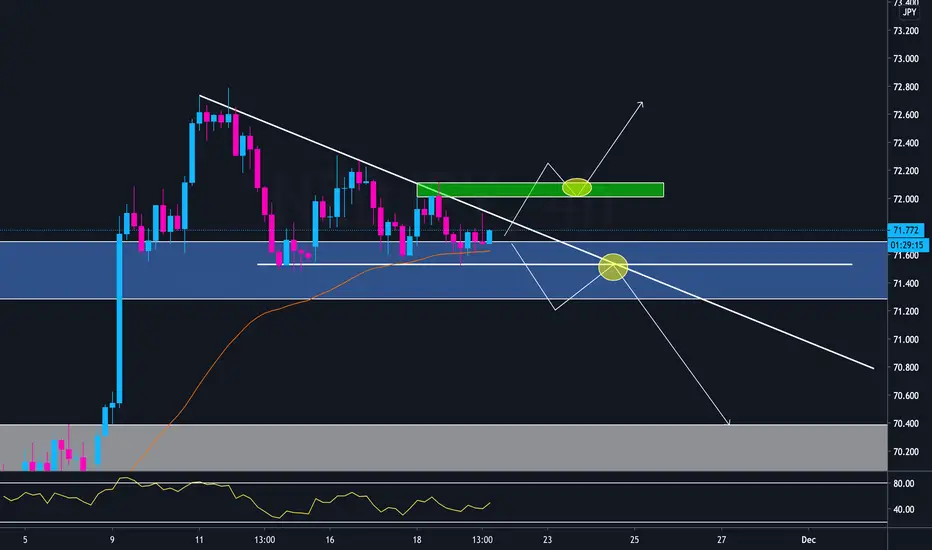
NZDJPY is showing a descending triangle formation at a key area of resistance. When we zoom out to the weekly, we can see the previous weekly candle showed a rejection of this zone and the current weekly candle is showing low bullish momentum. This pair has more potential to breakout to the downside rather than the upside but the market can do whatever it wants. For sells i'll be looking for a break of support and a retest, for buys i'll look for a break and retest of resistance.

Clause de non-responsabilité
Les informations et publications ne sont pas destinées à être, et ne constituent pas, des conseils ou recommandations financiers, d'investissement, de trading ou autres fournis ou approuvés par TradingView. Pour en savoir plus, consultez les Conditions d'utilisation.
Clause de non-responsabilité
Les informations et publications ne sont pas destinées à être, et ne constituent pas, des conseils ou recommandations financiers, d'investissement, de trading ou autres fournis ou approuvés par TradingView. Pour en savoir plus, consultez les Conditions d'utilisation.