
1. Technical Overview & Structure
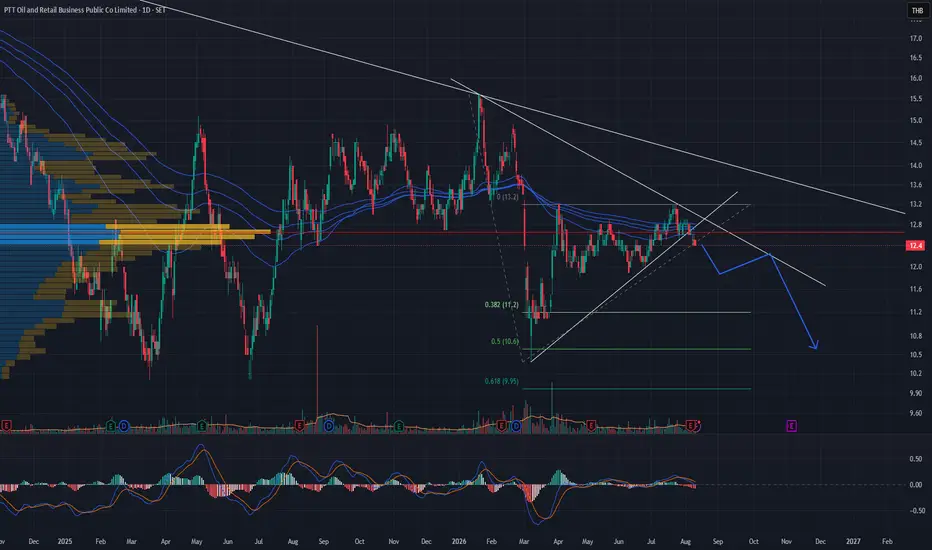
Macro Downtrend: Price action continues to operate within a broad macro descending structure, tightly capped by a long-term downward resistance line from prior highs.
Volume Profile & Accumulation Zone: A heavy concentration of High Volume Nodes sits in the lower range around 11.00 – 12.00, establishing a crucial structural demand floor and multi-month accumulation band.
Wedge / Triangle Compression: Price is consolidating within a converging range near historical support, reflecting a contraction in momentum as it approaches the apex. However, the projection path indicates a cautious outlook with a potential downside test toward structural support before any meaningful base is formed.
2. Key Price Targets (Fibonacci Retracement)
Short-Term Support Test (11.2): Aligned with the 0.382 Fibonacci Retracement level, serving as the immediate downside test level if the current consolidation range breaks lower.
Medium-Term Target (10.6): Corresponds to the 0.5 Fibonacci Retracement level, coming into play if broader selling pressure intensifies.
Deep Correction Target (9.95): Aligned with the 0.618 Fibonacci Retracement level, representing a deeper structural retracement toward macro demand clusters.
3. Risk Management
Invalidation Level / Resistance Break: A decisive bullish breakout above the upper descending trendline and moving average resistance cluster would invalidate this downside bias and signal a renewed trend reversal attempt.
Macro Downtrend: Price action continues to operate within a broad macro descending structure, tightly capped by a long-term downward resistance line from prior highs.
Volume Profile & Accumulation Zone: A heavy concentration of High Volume Nodes sits in the lower range around 11.00 – 12.00, establishing a crucial structural demand floor and multi-month accumulation band.
Wedge / Triangle Compression: Price is consolidating within a converging range near historical support, reflecting a contraction in momentum as it approaches the apex. However, the projection path indicates a cautious outlook with a potential downside test toward structural support before any meaningful base is formed.
2. Key Price Targets (Fibonacci Retracement)
Short-Term Support Test (11.2): Aligned with the 0.382 Fibonacci Retracement level, serving as the immediate downside test level if the current consolidation range breaks lower.
Medium-Term Target (10.6): Corresponds to the 0.5 Fibonacci Retracement level, coming into play if broader selling pressure intensifies.
Deep Correction Target (9.95): Aligned with the 0.618 Fibonacci Retracement level, representing a deeper structural retracement toward macro demand clusters.
3. Risk Management
Invalidation Level / Resistance Break: A decisive bullish breakout above the upper descending trendline and moving average resistance cluster would invalidate this downside bias and signal a renewed trend reversal attempt.

Clause de non-responsabilité
Les informations et publications ne sont pas destinées à être, et ne constituent pas, des conseils ou recommandations financiers, d'investissement, de trading ou autres fournis ou approuvés par TradingView. Pour en savoir plus, consultez les Conditions d'utilisation.
Clause de non-responsabilité
Les informations et publications ne sont pas destinées à être, et ne constituent pas, des conseils ou recommandations financiers, d'investissement, de trading ou autres fournis ou approuvés par TradingView. Pour en savoir plus, consultez les Conditions d'utilisation.