
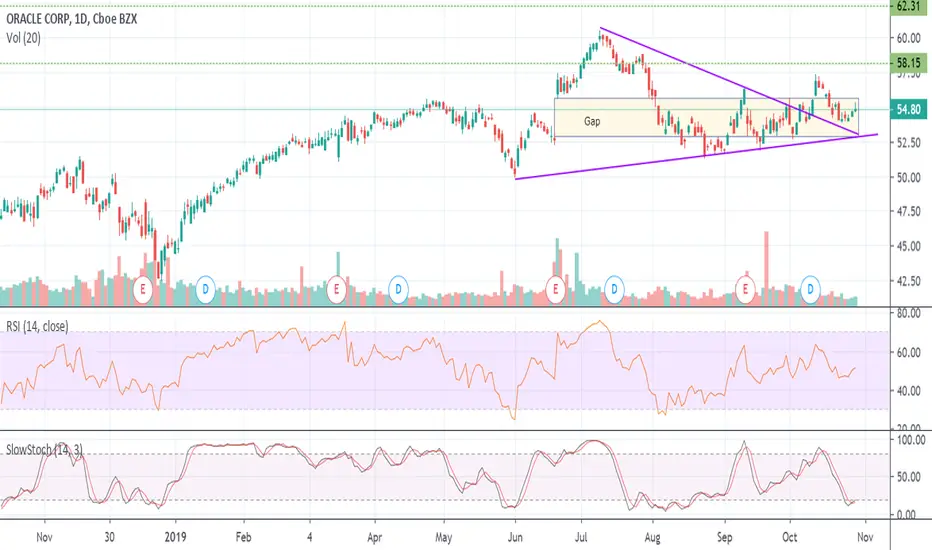
The stock has created a symmetrical triangle pattern since the beginning of June. Also mixed into this pattern is an earnings gap halfway through the month. The price has continued to trade within this gap range but the consolidation has led to the stock price moving out of the triangle pattern. The recent pullback, while remaining in the gap zone, is now testing the previous triangle resistance line as support. The stock is also exiting an oversold position.
I have two Fibonacci Extension levels targeted. The 61.8% & 100% levels are noted by the dashed green lines should the bullish move continue.
I have two Fibonacci Extension levels targeted. The 61.8% & 100% levels are noted by the dashed green lines should the bullish move continue.

Clause de non-responsabilité
Les informations et publications ne sont pas destinées à être, et ne constituent pas, des conseils ou recommandations financiers, d'investissement, de trading ou autres fournis ou approuvés par TradingView. Pour en savoir plus, consultez les Conditions d'utilisation.
Clause de non-responsabilité
Les informations et publications ne sont pas destinées à être, et ne constituent pas, des conseils ou recommandations financiers, d'investissement, de trading ou autres fournis ou approuvés par TradingView. Pour en savoir plus, consultez les Conditions d'utilisation.