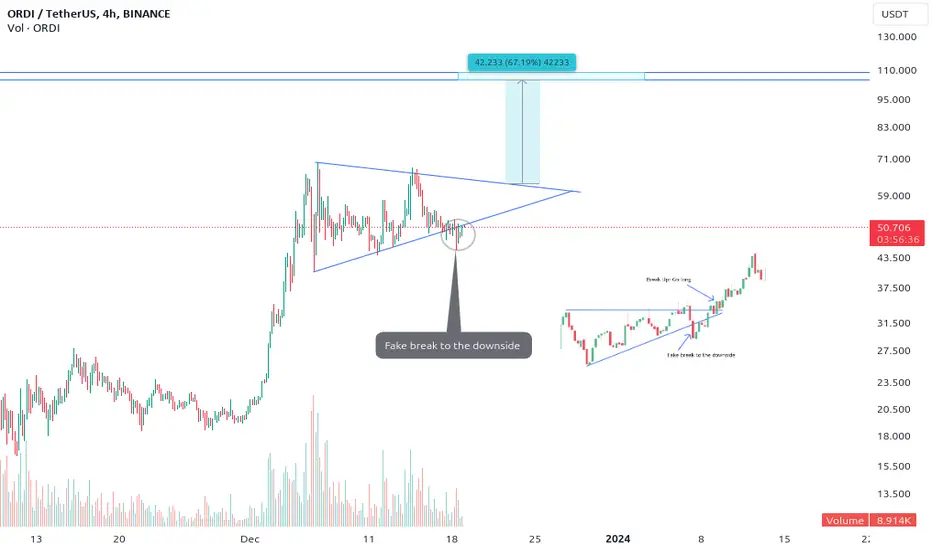
Based on the chart, there are several bullish patterns that could suggest the price of 
 ORDIUSDT is poised for further upward movement. Here are a few indicators:
In the event of an upward breakout, the target price ranges from $105 to $110.
Good Luck
ORDIUSDT is poised for further upward movement. Here are a few indicators:- Ascending Triangle: The price action is forming an ascending triangle, which is a continuation pattern that typically indicates a potential breakout to the upside.
- Rising Volume: The volume of trading has been increasing over the past few hours, which often accompanies bullish breakouts.
- Price Breaking Above Support: The price has recently broken above a key support level at 48.905 USDT. This level was previously acting as a constraint on the uptrend, and its breakout suggests that the upward movement may have gained momentum. If the price can sustain its gains above this level, it could further bolster the bullish sentiment.
In the event of an upward breakout, the target price ranges from $105 to $110.
Good Luck
Transaction en cours
The price quickly rebounding after a swift decline. What's next? Await the actual breakout to the upside, where the price is likely to rally.
Publications connexes
Clause de non-responsabilité
Les informations et publications ne sont pas destinées à être, et ne constituent pas, des conseils ou recommandations financiers, d'investissement, de trading ou autres fournis ou approuvés par TradingView. Pour en savoir plus, consultez les Conditions d'utilisation.
Publications connexes
Clause de non-responsabilité
Les informations et publications ne sont pas destinées à être, et ne constituent pas, des conseils ou recommandations financiers, d'investissement, de trading ou autres fournis ou approuvés par TradingView. Pour en savoir plus, consultez les Conditions d'utilisation.