
Macro Regime
The current macroeconomic climate for the Cosmos ecosystem, and Osmosis (OSMO) in particular, is defined by the maturation of cross-chain interoperability protocols.
As of May 2026, market participants are rotating capital from monolithic blockchains into interoperable "AppChains." Osmosis remains the primary liquidity hub for the IBC (Inter-Blockchain Communication) network. Recent data shows a significant increase in protocol-owned liquidity and fee-sharing mechanisms, which has begun to attract institutional yield-seekers. In a broader market context, as Bitcoin dominance stabilizes, high-utility DeFi protocols like OSMO often benefit from "liquidity trickling down" the risk curve.
Concept Explanation: An "AppChain" is a blockchain dedicated to a single application (like a specialized exchange). "Liquidity trickling down" means that after investors make money in big assets like Bitcoin, they move that profit into smaller, higher-growth projects.
Liquidity Conditions
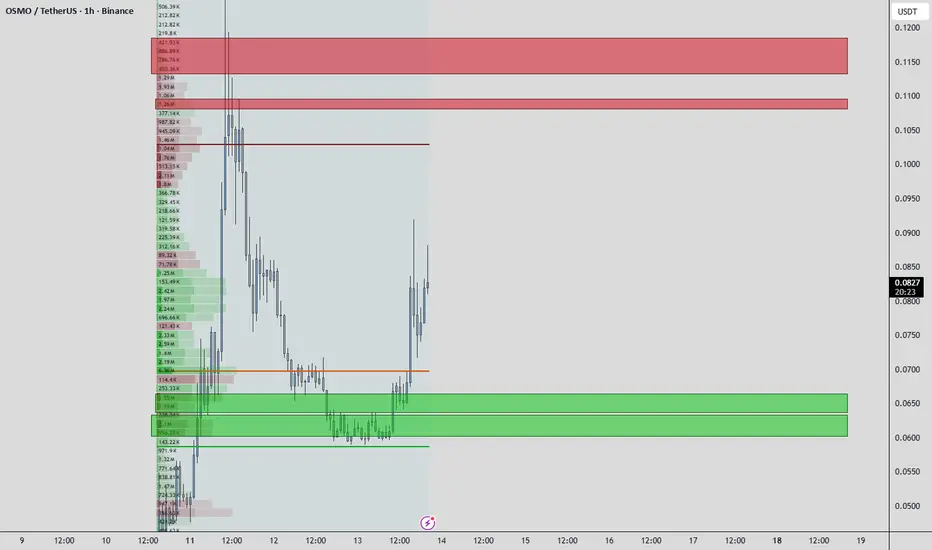
Analysis of chart reveals two distinct institutional interest zones:
Concept Explanation: "Passive Absorption" is when big players act like a "sponge," buying everything that panicked sellers throw at them without letting the price drop further. A "Supply Overhang" is an area where a lot of people are waiting to sell their tokens because they missed the chance during the last drop.
Market Structure
OSMO is currently transitioning from a "Distribution Phase" into a "Markup Phase." The price successfully defended the High Volume Node (HVN) near $0.0700 (indicated by the orange line). This level acted as the Point of Control (POC), the fair value price where most trading occurred. The recent impulsive bounce from the green boxes suggests that "Smart Money" has finished accumulating and is now ready to challenge the upper liquidity targets.
Concept Explanation: The "Point of Control" (POC) is the price level where the most trading activity happened. It acts like a magnet for the price. A "Markup Phase" is the stage of the market cycle where the price starts a sustained move upward.
Order Flow / Footprint Behavior
To confirm a continuation toward the $0.1100 red zone, we are monitoring for two specific footprint signatures:
Concept Explanation: "Cumulative Delta" tracks whether more people are clicking "Buy" or "Sell" at the market price. "Stacked Imbalances" happen when buyers are so aggressive that they overwhelm sellers at several price levels in a row, signaling strong institutional intent.
Correlated Assets
The primary intermarket relationship for OSMO is with ATOM (Cosmos Hub) and BTC. Currently, OSMO is showing "Relative Strength" against ATOM. This suggests that ecosystem-specific capital is flowing directly into the DEX token rather than the general hub token. If BTC remains in a "sideways" consolidation, it provides the perfect low-volatility environment for OSMO to expand toward its red supply zones.
Risk Sentiment
Sentiment is shifting from "Fear" to "Calculated Optimism." The successful defense of the $0.0600 level has provided a psychological floor for retail participants, while the institutional footprint shows a preference for holding (HODLing) rather than day-trading. This reduces the "sell pressure" on every minor bounce.
Institutional Interpretation
Institutional desks view the current price action as a "Re-Test of Value." Having established a floor at the green liquidity zone, they are likely aiming to "sweep" the liquidity sitting above the $0.1200 highs. The goal of large players here is to "induce" retail shorts at the POC, only to use those shorts as "buy liquidity" for a further squeeze higher.
Concept Explanation: A "Short Squeeze" happens when people betting against the price (shorts) are forced to buy back their positions to stop their losses, which ironically pushes the price up even faster.
Key Invalidation Levels
Concept Explanation: "Invalidation" is the specific price point where our plan is proven wrong. If price goes there, the "Big Players" have changed their minds and we should exit the trade.
Upcoming Macro Catalysts
Keep an eye on the upcoming Cosmos ecosystem governance upgrades and the "Staking Rewards" adjustments. Any increase in the "Real Yield" for OSMO stakers will act as the fundamental fuel required to break through the $0.1100 red resistance zone.
Conclusion
OSMO is at a textbook institutional pivot point. After a successful defense of the green demand zone, the market is now testing the strength of the POC. The structural path of least resistance is toward the red supply zones at $0.1100+. We are waiting for footprint confirmation of "Buyers with Result" at the current levels to solidify the move. Manage risk at the $0.0600 level and watch for the liquidity grab at the highs.
The current macroeconomic climate for the Cosmos ecosystem, and Osmosis (OSMO) in particular, is defined by the maturation of cross-chain interoperability protocols.
As of May 2026, market participants are rotating capital from monolithic blockchains into interoperable "AppChains." Osmosis remains the primary liquidity hub for the IBC (Inter-Blockchain Communication) network. Recent data shows a significant increase in protocol-owned liquidity and fee-sharing mechanisms, which has begun to attract institutional yield-seekers. In a broader market context, as Bitcoin dominance stabilizes, high-utility DeFi protocols like OSMO often benefit from "liquidity trickling down" the risk curve.
Concept Explanation: An "AppChain" is a blockchain dedicated to a single application (like a specialized exchange). "Liquidity trickling down" means that after investors make money in big assets like Bitcoin, they move that profit into smaller, higher-growth projects.
Liquidity Conditions
Analysis of chart reveals two distinct institutional interest zones:
- The Green Demand Zone [$0.0600 - $0.0660]: This is a high-conviction re-accumulation area. The volume profile shows significant "Passive Absorption" here, where large participants utilized limit orders to catch the previous sell-off.
- The Red Supply Overhang [$0.1100 - $0.1200]: These zones represent "Unfilled Institutional Sell Orders." Because the price dropped rapidly from here previously, many large sell orders remain waiting for a revisit.
Concept Explanation: "Passive Absorption" is when big players act like a "sponge," buying everything that panicked sellers throw at them without letting the price drop further. A "Supply Overhang" is an area where a lot of people are waiting to sell their tokens because they missed the chance during the last drop.
Market Structure
OSMO is currently transitioning from a "Distribution Phase" into a "Markup Phase." The price successfully defended the High Volume Node (HVN) near $0.0700 (indicated by the orange line). This level acted as the Point of Control (POC), the fair value price where most trading occurred. The recent impulsive bounce from the green boxes suggests that "Smart Money" has finished accumulating and is now ready to challenge the upper liquidity targets.
Concept Explanation: The "Point of Control" (POC) is the price level where the most trading activity happened. It acts like a magnet for the price. A "Markup Phase" is the stage of the market cycle where the price starts a sustained move upward.
Order Flow / Footprint Behavior
To confirm a continuation toward the $0.1100 red zone, we are monitoring for two specific footprint signatures:
- Cumulative Delta Divergence: We want to see the price rising even if the "Delta" (the difference between market buys and sells) stays flat. This indicates that sellers are exhausted and buyers don't need to be aggressive to move the price.
- Buyers with Result: As price approaches the POC ($0.0700) and the mid-range resistance, we look for "Stacked Buy Imbalances",multiple levels of aggressive market buying that successfully push the price higher.
Concept Explanation: "Cumulative Delta" tracks whether more people are clicking "Buy" or "Sell" at the market price. "Stacked Imbalances" happen when buyers are so aggressive that they overwhelm sellers at several price levels in a row, signaling strong institutional intent.
Correlated Assets
The primary intermarket relationship for OSMO is with ATOM (Cosmos Hub) and BTC. Currently, OSMO is showing "Relative Strength" against ATOM. This suggests that ecosystem-specific capital is flowing directly into the DEX token rather than the general hub token. If BTC remains in a "sideways" consolidation, it provides the perfect low-volatility environment for OSMO to expand toward its red supply zones.
Risk Sentiment
Sentiment is shifting from "Fear" to "Calculated Optimism." The successful defense of the $0.0600 level has provided a psychological floor for retail participants, while the institutional footprint shows a preference for holding (HODLing) rather than day-trading. This reduces the "sell pressure" on every minor bounce.
Institutional Interpretation
Institutional desks view the current price action as a "Re-Test of Value." Having established a floor at the green liquidity zone, they are likely aiming to "sweep" the liquidity sitting above the $0.1200 highs. The goal of large players here is to "induce" retail shorts at the POC, only to use those shorts as "buy liquidity" for a further squeeze higher.
Concept Explanation: A "Short Squeeze" happens when people betting against the price (shorts) are forced to buy back their positions to stop their losses, which ironically pushes the price up even faster.
Key Invalidation Levels
- The Bullish Thesis Invalidation: A 4-hour close below the green box ($0.0600). This would indicate that the "Passive Bids" have been overwhelmed and that a "Liquidity Void" exists below, potentially leading to a move back toward $0.0400.
Concept Explanation: "Invalidation" is the specific price point where our plan is proven wrong. If price goes there, the "Big Players" have changed their minds and we should exit the trade.
Upcoming Macro Catalysts
Keep an eye on the upcoming Cosmos ecosystem governance upgrades and the "Staking Rewards" adjustments. Any increase in the "Real Yield" for OSMO stakers will act as the fundamental fuel required to break through the $0.1100 red resistance zone.
Conclusion
OSMO is at a textbook institutional pivot point. After a successful defense of the green demand zone, the market is now testing the strength of the POC. The structural path of least resistance is toward the red supply zones at $0.1100+. We are waiting for footprint confirmation of "Buyers with Result" at the current levels to solidify the move. Manage risk at the $0.0600 level and watch for the liquidity grab at the highs.

Clause de non-responsabilité
Les informations et publications ne sont pas destinées à être, et ne constituent pas, des conseils ou recommandations financiers, d'investissement, de trading ou autres fournis ou approuvés par TradingView. Pour en savoir plus, consultez les Conditions d'utilisation.
Clause de non-responsabilité
Les informations et publications ne sont pas destinées à être, et ne constituent pas, des conseils ou recommandations financiers, d'investissement, de trading ou autres fournis ou approuvés par TradingView. Pour en savoir plus, consultez les Conditions d'utilisation.