
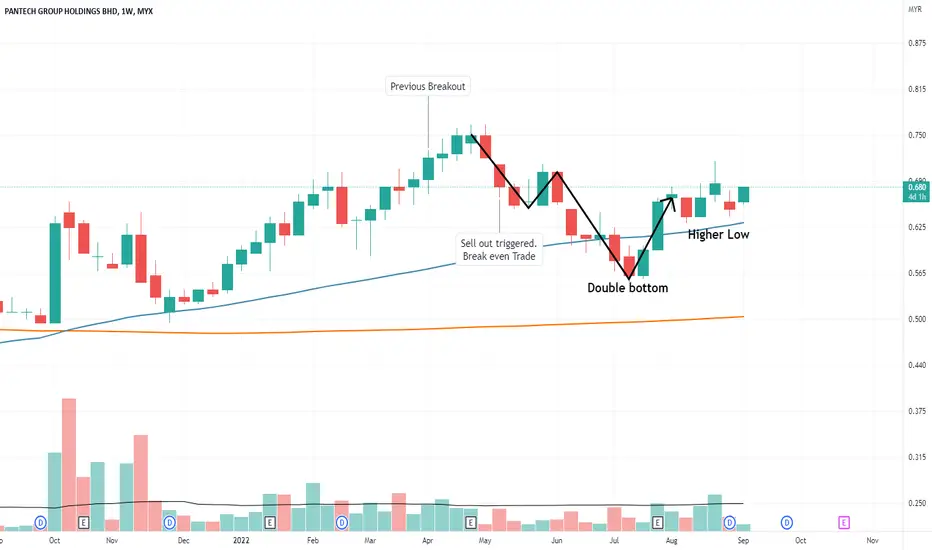
I shared PANTECH chart back then in 30th March (link below). The breakout doesn't last long and sell out was triggered due to break support. This is a breakeven trade back then.
The chart that formed a double bottom. And recently higher low is observed with volume start to come in. QR look decent too. Will PANTECH further attack?
Disclaimer:
Information presented here is not intended to be used as the sole basis of any investment decisions nor should it be construed as advice designed to meet the investment need of any investor. Trade at your own risk.
The chart that formed a double bottom. And recently higher low is observed with volume start to come in. QR look decent too. Will PANTECH further attack?
Disclaimer:
Information presented here is not intended to be used as the sole basis of any investment decisions nor should it be construed as advice designed to meet the investment need of any investor. Trade at your own risk.
Note
Breakout 0.860 beginning of Sep. Pulling back since then to re-test 0.860 as support.
Publications connexes
Clause de non-responsabilité
Les informations et publications ne sont pas destinées à être, et ne constituent pas, des conseils ou recommandations financiers, d'investissement, de trading ou autres fournis ou approuvés par TradingView. Pour en savoir plus, consultez les Conditions d'utilisation.
Publications connexes
Clause de non-responsabilité
Les informations et publications ne sont pas destinées à être, et ne constituent pas, des conseils ou recommandations financiers, d'investissement, de trading ou autres fournis ou approuvés par TradingView. Pour en savoir plus, consultez les Conditions d'utilisation.