
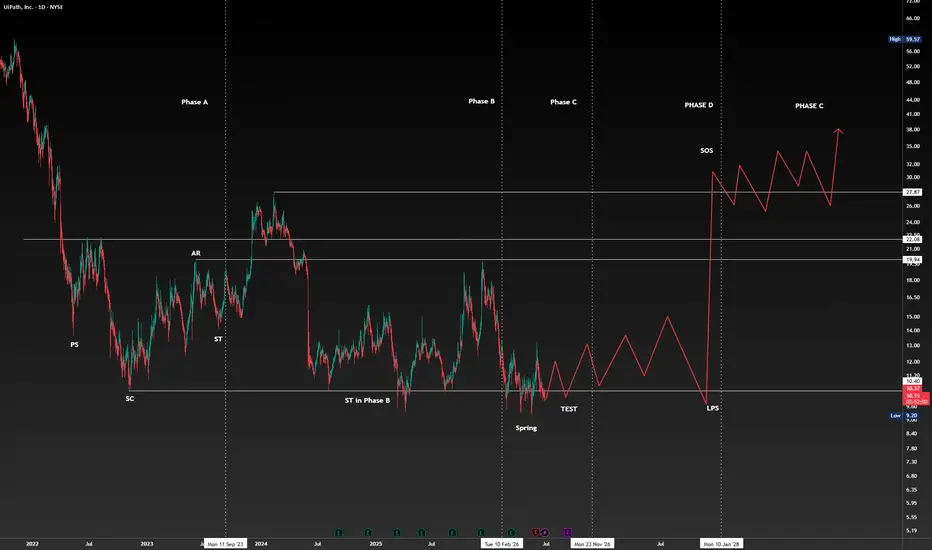
The price action of PATH appears to be unfolding within a classic Wyckoff Accumulation schematic, suggesting a potential shift from distribution to accumulation and the early stages of a bullish reversal.
🧩 Structural Breakdown
Phase A: The market shows initial stopping action with Preliminary Support (PS) and a Selling Climax (SC), signaling exhaustion of selling pressure.
Phase B: A broad trading range develops, marked by Automatic Rally (AR) and Secondary Tests (ST), where supply is being absorbed.
Phase C: A Spring/Test phase occurs — a shakeout below support that traps late sellers and confirms institutional accumulation.
Phase D: Emergence of a Sign of Strength (SOS) and Last Point of Support (LPS), where demand begins to dominate and price breaks key resistance levels.
Phase E: Expected markup phase, characterized by higher highs and higher lows as the new uptrend takes shape.
📈 Outlook
If the Wyckoff structure completes successfully, PATH could enter a sustained bullish phase. Confirmation will come with a decisive breakout above the SOS zone, supported by rising volume and successful retests of the LPS area.
🧩 Structural Breakdown
Phase A: The market shows initial stopping action with Preliminary Support (PS) and a Selling Climax (SC), signaling exhaustion of selling pressure.
Phase B: A broad trading range develops, marked by Automatic Rally (AR) and Secondary Tests (ST), where supply is being absorbed.
Phase C: A Spring/Test phase occurs — a shakeout below support that traps late sellers and confirms institutional accumulation.
Phase D: Emergence of a Sign of Strength (SOS) and Last Point of Support (LPS), where demand begins to dominate and price breaks key resistance levels.
Phase E: Expected markup phase, characterized by higher highs and higher lows as the new uptrend takes shape.
📈 Outlook
If the Wyckoff structure completes successfully, PATH could enter a sustained bullish phase. Confirmation will come with a decisive breakout above the SOS zone, supported by rising volume and successful retests of the LPS area.
Note
TestNote
wonderfulTransaction en cours
LPS
Clause de non-responsabilité
Les informations et publications ne sont pas destinées à être, et ne constituent pas, des conseils ou recommandations financiers, d'investissement, de trading ou autres fournis ou approuvés par TradingView. Pour en savoir plus, consultez les Conditions d'utilisation.
Clause de non-responsabilité
Les informations et publications ne sont pas destinées à être, et ne constituent pas, des conseils ou recommandations financiers, d'investissement, de trading ou autres fournis ou approuvés par TradingView. Pour en savoir plus, consultez les Conditions d'utilisation.