
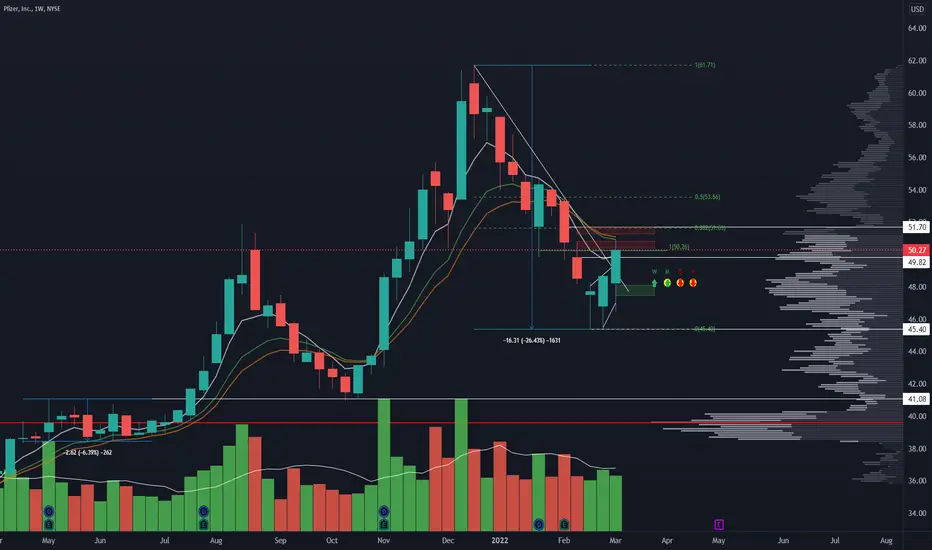
PFE Weekly Chart :
- Broke Downtrend trend line.
- Meet 10 EMA on the weekly = important resistance : we are seeing rejection of the 51-50 levels.
- Holding 48$ level is crucial for PFE to stay in it current uptrend. Above 51 PFE will likely go for the gap fill to reach around 52.70.
- With current market condition it is probable to have some kind of pullback next week : key point here is we need to see lower volume pullback with smaller candle than green candle. Optimal scenario is that we see a bounce back immediately after a pullback. That will signal relative strength and constant buying of the stock.

Clause de non-responsabilité
Les informations et publications ne sont pas destinées à être, et ne constituent pas, des conseils ou recommandations financiers, d'investissement, de trading ou autres fournis ou approuvés par TradingView. Pour en savoir plus, consultez les Conditions d'utilisation.
Clause de non-responsabilité
Les informations et publications ne sont pas destinées à être, et ne constituent pas, des conseils ou recommandations financiers, d'investissement, de trading ou autres fournis ou approuvés par TradingView. Pour en savoir plus, consultez les Conditions d'utilisation.