
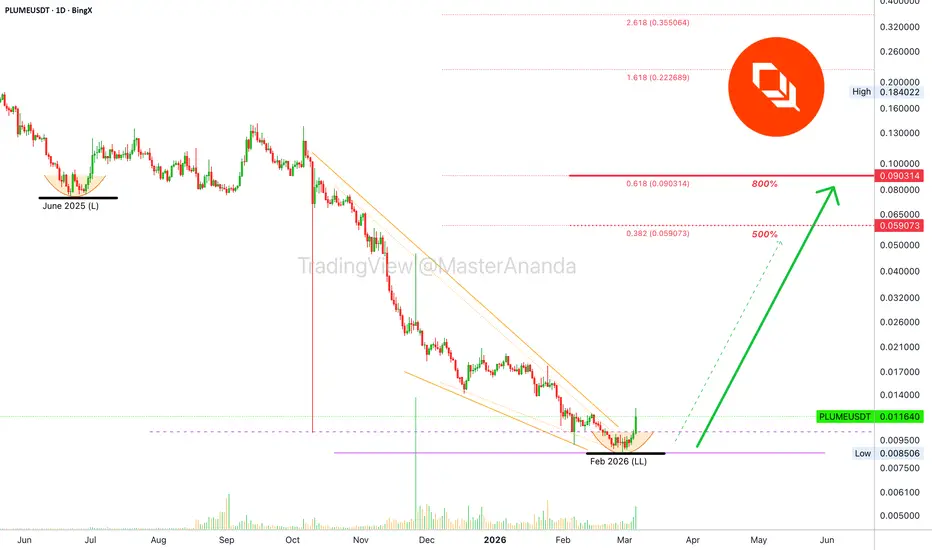
Here is simplicity at its best. PLUMEUSDT was moving within an ending diagonal, produced a rounded bottom and now a full bullish breakout to start a change of trend.
A bullish bias is fully confirmed as the breakout is a recovery above the October 2025 low. This is a powerful combination of signals.
Let me show you how a strong double bullish divergence works to predict an upcoming change of trend.
PLUMEUSDT going bullish at this juncture supports the rest of the market, and a continuation for Bitcoin.
PLUME daily RSI

›› Notice how the RSI first produces a double-bottom, then a very strong bullish divergence and finally an entrance within the bullish zone (above 50).
›› The RSI hit bottom in June 2025. PLUME continued lower, much lower. This is the divergence. Higher low on the RSI (June 2025 vs Feb 2026) vs lower low on PLUME (Feb 2026 vs June 2025).
PLUME daily MACD

›› Notice how the MACD hits bottom June 2025, a long time ago. The higher low came in November last year and now it continues to rise higher. (Bullish divergence.)
›› Notice how the MACD is still within the bearish zone but trending up for more than half a year. When it looks like this, I read it as: There is plenty of room left available for additional growth.
Conclusion
Here we have a very strong combination of bullish signals. A bullish divergence with the MACD as the RSI becomes super strong. A bullish breakout happening after an all-time low. Recovery above the October 2025 low and the same bearish chart from which many pairs are starting to grow.
We can also appreciate how the 6-February low isn't the true bottom, PLUME went even lower and this is true for many other trading pairs. The conclusion to take home is the fact that this lower low in late February doesn't change the chart structure, it is equivalent to a double-bottom based on a simple liquidity hunt event.
This chart supports a bullish market. A volume breakout is also happening today. Today's session is likely to end with the highest volume since late November 2025 and this will support the bullish wave that follows.
Bitcoin will also grow. And many projects with a similar chart will wake up.
Namaste.
A bullish bias is fully confirmed as the breakout is a recovery above the October 2025 low. This is a powerful combination of signals.
Let me show you how a strong double bullish divergence works to predict an upcoming change of trend.
PLUMEUSDT going bullish at this juncture supports the rest of the market, and a continuation for Bitcoin.
PLUME daily RSI
›› Notice how the RSI first produces a double-bottom, then a very strong bullish divergence and finally an entrance within the bullish zone (above 50).
›› The RSI hit bottom in June 2025. PLUME continued lower, much lower. This is the divergence. Higher low on the RSI (June 2025 vs Feb 2026) vs lower low on PLUME (Feb 2026 vs June 2025).
PLUME daily MACD
›› Notice how the MACD hits bottom June 2025, a long time ago. The higher low came in November last year and now it continues to rise higher. (Bullish divergence.)
›› Notice how the MACD is still within the bearish zone but trending up for more than half a year. When it looks like this, I read it as: There is plenty of room left available for additional growth.
Conclusion
Here we have a very strong combination of bullish signals. A bullish divergence with the MACD as the RSI becomes super strong. A bullish breakout happening after an all-time low. Recovery above the October 2025 low and the same bearish chart from which many pairs are starting to grow.
We can also appreciate how the 6-February low isn't the true bottom, PLUME went even lower and this is true for many other trading pairs. The conclusion to take home is the fact that this lower low in late February doesn't change the chart structure, it is equivalent to a double-bottom based on a simple liquidity hunt event.
This chart supports a bullish market. A volume breakout is also happening today. Today's session is likely to end with the highest volume since late November 2025 and this will support the bullish wave that follows.
Bitcoin will also grow. And many projects with a similar chart will wake up.
Namaste.

💯 TOP Results (Sept 2026) 👇
t.me/masteranandatrades/9279
🔥 10-25X Leverage, Results & Profits
t.me/masteranandatrades/9271
✅ 4 PREMIUM Telegram channels special offer
—One-Time Payment! (🔝 since 2017)
t.me/lamatrades/4
t.me/masteranandatrades/9279
🔥 10-25X Leverage, Results & Profits
t.me/masteranandatrades/9271
✅ 4 PREMIUM Telegram channels special offer
—One-Time Payment! (🔝 since 2017)
t.me/lamatrades/4
Publications connexes
Clause de non-responsabilité
Les informations et publications ne sont pas destinées à être, et ne constituent pas, des conseils ou recommandations financiers, d'investissement, de trading ou autres fournis ou approuvés par TradingView. Pour en savoir plus, consultez les Conditions d'utilisation.
💯 TOP Results (Sept 2026) 👇
t.me/masteranandatrades/9279
🔥 10-25X Leverage, Results & Profits
t.me/masteranandatrades/9271
✅ 4 PREMIUM Telegram channels special offer
—One-Time Payment! (🔝 since 2017)
t.me/lamatrades/4
t.me/masteranandatrades/9279
🔥 10-25X Leverage, Results & Profits
t.me/masteranandatrades/9271
✅ 4 PREMIUM Telegram channels special offer
—One-Time Payment! (🔝 since 2017)
t.me/lamatrades/4
Publications connexes
Clause de non-responsabilité
Les informations et publications ne sont pas destinées à être, et ne constituent pas, des conseils ou recommandations financiers, d'investissement, de trading ou autres fournis ou approuvés par TradingView. Pour en savoir plus, consultez les Conditions d'utilisation.