
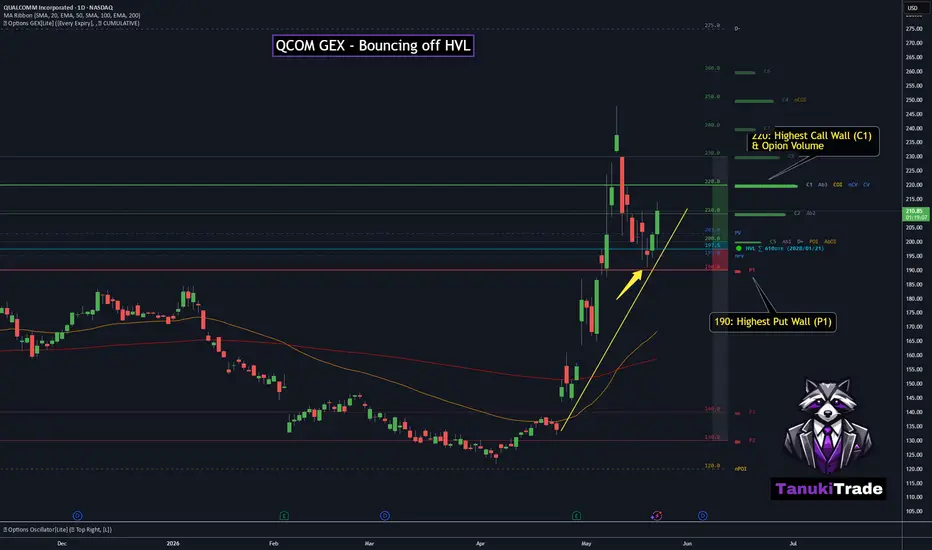
QCOM is showing a constructive bounce from a key options-driven regime level.
On the daily chart, price recently reacted from the 197.5 High Volatility Level (HVL) and is now continuing within an upward trend structure after a healthy pullback.
This matters because HVL often acts as a key regime pivot. As long as price holds above this zone, QCOM remains in a more constructive gamma environment, where volatility can become more controlled compared to reactive downside conditions.
🔶 Options Structure Context 🔶
The next major upside level to watch is:
👉 220 – highest call wall
This level is especially important because it has multiple layers of confluence:
- highest call GEX level
- highest call open interest
- highest call volume
- confluence zone on the chart
That makes 220 a clear reaction zone, not just a random resistance level.
🔶 Downside Structure 🔶
The main downside reference is:
👉 190 – P1 / strongest put wall
This level sits below HVL and becomes much more important if price loses the 197.5 HVL level.
🔶 Key Structure to Watch 🔶
197.5 (HVL) – regime pivot / recent bounce zone
220 – major call wall and confluence target
190 – strongest put wall below HVL
Uptrend structure – still intact after pullback
For now, QCOM remains in an upward trend after bouncing from HVL.
The key question is whether momentum can carry price toward the 220 call wall, and more importantly, how the market reacts once it gets there.
On the daily chart, price recently reacted from the 197.5 High Volatility Level (HVL) and is now continuing within an upward trend structure after a healthy pullback.
This matters because HVL often acts as a key regime pivot. As long as price holds above this zone, QCOM remains in a more constructive gamma environment, where volatility can become more controlled compared to reactive downside conditions.
🔶 Options Structure Context 🔶
The next major upside level to watch is:
👉 220 – highest call wall
This level is especially important because it has multiple layers of confluence:
- highest call GEX level
- highest call open interest
- highest call volume
- confluence zone on the chart
That makes 220 a clear reaction zone, not just a random resistance level.
🔶 Downside Structure 🔶
The main downside reference is:
👉 190 – P1 / strongest put wall
This level sits below HVL and becomes much more important if price loses the 197.5 HVL level.
🔶 Key Structure to Watch 🔶
197.5 (HVL) – regime pivot / recent bounce zone
220 – major call wall and confluence target
190 – strongest put wall below HVL
Uptrend structure – still intact after pullback
For now, QCOM remains in an upward trend after bouncing from HVL.
The key question is whether momentum can carry price toward the 220 call wall, and more importantly, how the market reacts once it gets there.

Boost up your charts with Options PRO!
REAL Options metrics for over 250+ liquid US symbols:
✔ 𝗔𝘂𝘁𝗼-𝗨𝗽𝗱𝗮𝘁𝗶𝗻𝗴 𝗚𝗘𝗫 𝗹𝗲𝘃𝗲𝗹𝘀
✔ GEX ✔ IVRank ✔ CALL/PUT skew ✔ Volatility✔ Delta curves
👉 7-day FREE TRIAL 🌐 TanukiTrade.com
REAL Options metrics for over 250+ liquid US symbols:
✔ 𝗔𝘂𝘁𝗼-𝗨𝗽𝗱𝗮𝘁𝗶𝗻𝗴 𝗚𝗘𝗫 𝗹𝗲𝘃𝗲𝗹𝘀
✔ GEX ✔ IVRank ✔ CALL/PUT skew ✔ Volatility✔ Delta curves
👉 7-day FREE TRIAL 🌐 TanukiTrade.com
Publications connexes
Clause de non-responsabilité
Les informations et publications ne sont pas destinées à être, et ne constituent pas, des conseils ou recommandations financiers, d'investissement, de trading ou autres fournis ou approuvés par TradingView. Pour en savoir plus, consultez les Conditions d'utilisation.
Boost up your charts with Options PRO!
REAL Options metrics for over 250+ liquid US symbols:
✔ 𝗔𝘂𝘁𝗼-𝗨𝗽𝗱𝗮𝘁𝗶𝗻𝗴 𝗚𝗘𝗫 𝗹𝗲𝘃𝗲𝗹𝘀
✔ GEX ✔ IVRank ✔ CALL/PUT skew ✔ Volatility✔ Delta curves
👉 7-day FREE TRIAL 🌐 TanukiTrade.com
REAL Options metrics for over 250+ liquid US symbols:
✔ 𝗔𝘂𝘁𝗼-𝗨𝗽𝗱𝗮𝘁𝗶𝗻𝗴 𝗚𝗘𝗫 𝗹𝗲𝘃𝗲𝗹𝘀
✔ GEX ✔ IVRank ✔ CALL/PUT skew ✔ Volatility✔ Delta curves
👉 7-day FREE TRIAL 🌐 TanukiTrade.com
Publications connexes
Clause de non-responsabilité
Les informations et publications ne sont pas destinées à être, et ne constituent pas, des conseils ou recommandations financiers, d'investissement, de trading ou autres fournis ou approuvés par TradingView. Pour en savoir plus, consultez les Conditions d'utilisation.