
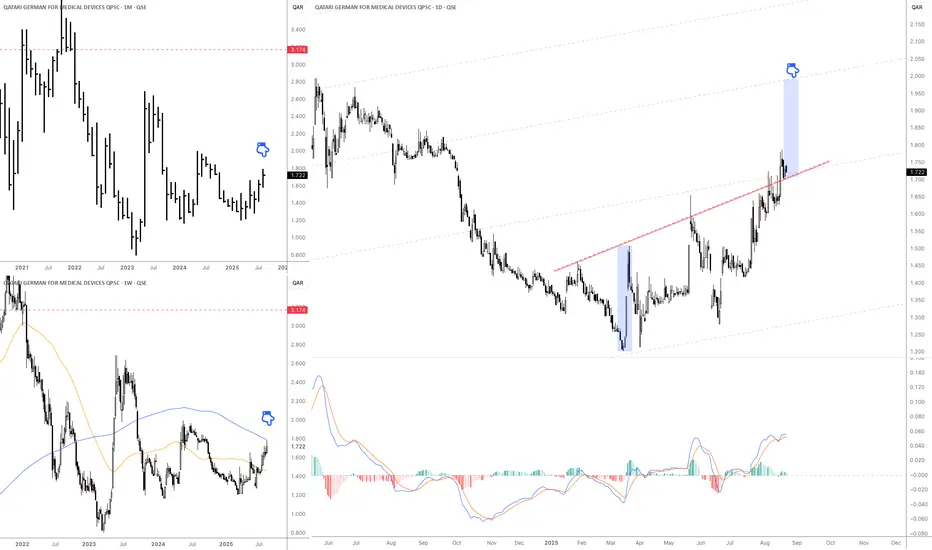
1. Monthly Chart (top-left)
Current price is around QAR 1.72 – 1.80.
Long-term trend has been bearish, but the stock seems to be forming a base and gradually moving higher.
Major long-term resistance sits at QAR 3.17.
2. Weekly Chart (bottom-left)
The 200-week moving average (blue) is close to the current price → a strong resistance test.
A confirmed breakout above the 200-week MA would strengthen the bullish case.
The 50-week moving average (orange) is turning upward, signaling improving momentum.
3. Daily Chart (right side)
The stock broke above a downtrend line (red) and is now holding above it, showing a bullish breakout.
The projected short-term target is around QAR 2.00 – 2.05, based on the rising channel.
MACD indicator is positive, supporting continued bullish momentum.
Key Levels
Nearest Support: QAR 1.60 – 1.65
Short-term Resistance: QAR 2.00 – 2.05
Long-term Resistance: QAR 3.17
Current price is around QAR 1.72 – 1.80.
Long-term trend has been bearish, but the stock seems to be forming a base and gradually moving higher.
Major long-term resistance sits at QAR 3.17.
2. Weekly Chart (bottom-left)
The 200-week moving average (blue) is close to the current price → a strong resistance test.
A confirmed breakout above the 200-week MA would strengthen the bullish case.
The 50-week moving average (orange) is turning upward, signaling improving momentum.
3. Daily Chart (right side)
The stock broke above a downtrend line (red) and is now holding above it, showing a bullish breakout.
The projected short-term target is around QAR 2.00 – 2.05, based on the rising channel.
MACD indicator is positive, supporting continued bullish momentum.
Key Levels
Nearest Support: QAR 1.60 – 1.65
Short-term Resistance: QAR 2.00 – 2.05
Long-term Resistance: QAR 3.17

Clause de non-responsabilité
Les informations et publications ne sont pas destinées à être, et ne constituent pas, des conseils ou recommandations financiers, d'investissement, de trading ou autres fournis ou approuvés par TradingView. Pour en savoir plus, consultez les Conditions d'utilisation.
Clause de non-responsabilité
Les informations et publications ne sont pas destinées à être, et ne constituent pas, des conseils ou recommandations financiers, d'investissement, de trading ou autres fournis ou approuvés par TradingView. Pour en savoir plus, consultez les Conditions d'utilisation.