
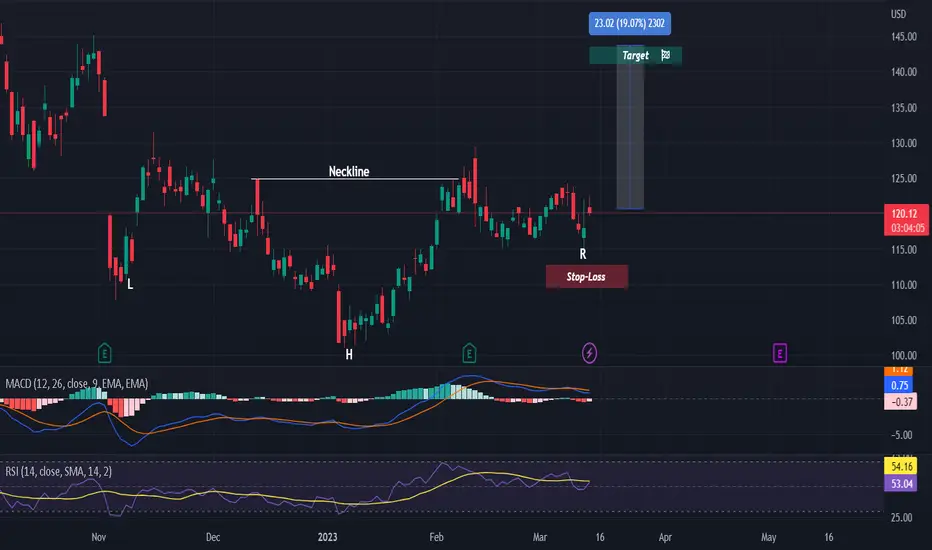
On the chart, we can see an inverse head and shoulders, which is a strong bullish pattern.
Both MACD and RSI are indicating bullish crossings.
We will now wait for a breakout of the neckline, to take our entry.
More details are shown on the chart.
Good luck! 🚀
Both MACD and RSI are indicating bullish crossings.
We will now wait for a breakout of the neckline, to take our entry.
More details are shown on the chart.
Good luck! 🚀

💥 Free signals and ideas ➡ t.me/vfinvestment
Publications connexes
Clause de non-responsabilité
Les informations et publications ne sont pas destinées à être, et ne constituent pas, des conseils ou recommandations financiers, d'investissement, de trading ou autres fournis ou approuvés par TradingView. Pour en savoir plus, consultez les Conditions d'utilisation.