
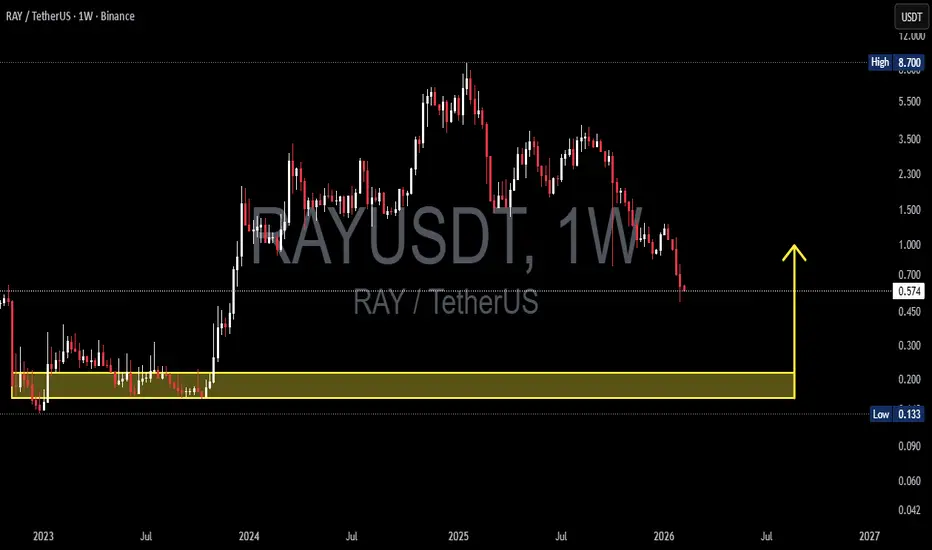
On the Weekly timeframe, RAYUSDT remains in a clear macro downtrend after forming its peak around the 8.7 USDT region. Following a distribution phase in the mid-range area (2 – 3.5), price continued declining gradually, forming consistent lower highs and lower lows.
Currently, price action is approaching a major historical demand / support zone that previously acted as the accumulation base before the massive 2024 rally.
Key zone:
0.215 – 0.160 USDT (Weekly Demand Block)
This area will determine whether the structure forms a macro bottom or continues into a deeper breakdown.
---
Pattern Explanation
1. Macro Distribution → Markdown Phase
After the parabolic rally, price entered distribution.
Wide consolidation range formed.
Support breakdown triggered further markdown.
2. Descending Structure
Characteristics visible on the chart:
Consecutive Lower Highs.
Gradual Lower Lows.
No significant bullish structure break yet.
3. Potential Double Bottom / Accumulation Base
If the demand zone holds, possible formations include:
Double Bottom.
Rounded Base.
Wyckoff Accumulation (Phase A–C).
The yellow zone acts as the last line of defense for buyers.
---
Key Levels
Resistance:
1.00 USDT — Psychological + minor structure.
1.50 USDT — Previous consolidation area.
2.30 – 3.50 USDT — Major supply zone.
5.50+ USDT — Macro distribution region.
Support / Demand:
0.573 USDT — Current reaction level.
0.215 – 0.160 USDT — Major Weekly Demand (Highlighted).
0.133 USDT — Absolute historical low.
---
Bullish Scenario
Bullish confirmation requires:
1. Price sweeps / taps the 0.215 – 0.160 demand zone.
2. Strong rejection appears (long wick / Weekly bullish engulfing).
3. Volume expansion at the lows.
4. Structure break above 1.00 USDT.
Potential upside targets:
Relief rally toward 1.00.
Continuation to 1.50.
Mid-term reversal toward 2.30 – 3.50.
If large accumulation occurs, the macro upside could expand significantly since this zone was the base of the previous rally.
---
Bearish Scenario
Bearish continuation triggers if:
1. Weekly close breaks below 0.160.
2. Demand zone fails to hold.
3. No significant volume reaction appears.
Implications:
Drop toward 0.133 (ATL retest).
If ATL breaks → downside price discovery.
Structure shifts into long-term markdown continuation.
The yellow zone would flip from demand into supply.
---
Conclusion
RAYUSDT is currently at a critical macro level.
Primary trend: Bearish.
Price is approaching major historical demand.
The 0.215 – 0.160 zone will decide reversal vs continuation.
Price reaction here will determine whether the market forms:
A macro bottom, or
A deeper bear market expansion.
Traders should wait for clear price action confirmation before taking large positions.
#RAYUSDT #RAY #Raydium #CryptoAnalysis #TechnicalAnalysis #Altcoins #SupportResistance #Wyckoff #CryptoTrading #Downtrend #Accumulation #MarketStructure #AltcoinSeason #CryptoChart
Currently, price action is approaching a major historical demand / support zone that previously acted as the accumulation base before the massive 2024 rally.
Key zone:
0.215 – 0.160 USDT (Weekly Demand Block)
This area will determine whether the structure forms a macro bottom or continues into a deeper breakdown.
---
Pattern Explanation
1. Macro Distribution → Markdown Phase
After the parabolic rally, price entered distribution.
Wide consolidation range formed.
Support breakdown triggered further markdown.
2. Descending Structure
Characteristics visible on the chart:
Consecutive Lower Highs.
Gradual Lower Lows.
No significant bullish structure break yet.
3. Potential Double Bottom / Accumulation Base
If the demand zone holds, possible formations include:
Double Bottom.
Rounded Base.
Wyckoff Accumulation (Phase A–C).
The yellow zone acts as the last line of defense for buyers.
---
Key Levels
Resistance:
1.00 USDT — Psychological + minor structure.
1.50 USDT — Previous consolidation area.
2.30 – 3.50 USDT — Major supply zone.
5.50+ USDT — Macro distribution region.
Support / Demand:
0.573 USDT — Current reaction level.
0.215 – 0.160 USDT — Major Weekly Demand (Highlighted).
0.133 USDT — Absolute historical low.
---
Bullish Scenario
Bullish confirmation requires:
1. Price sweeps / taps the 0.215 – 0.160 demand zone.
2. Strong rejection appears (long wick / Weekly bullish engulfing).
3. Volume expansion at the lows.
4. Structure break above 1.00 USDT.
Potential upside targets:
Relief rally toward 1.00.
Continuation to 1.50.
Mid-term reversal toward 2.30 – 3.50.
If large accumulation occurs, the macro upside could expand significantly since this zone was the base of the previous rally.
---
Bearish Scenario
Bearish continuation triggers if:
1. Weekly close breaks below 0.160.
2. Demand zone fails to hold.
3. No significant volume reaction appears.
Implications:
Drop toward 0.133 (ATL retest).
If ATL breaks → downside price discovery.
Structure shifts into long-term markdown continuation.
The yellow zone would flip from demand into supply.
---
Conclusion
RAYUSDT is currently at a critical macro level.
Primary trend: Bearish.
Price is approaching major historical demand.
The 0.215 – 0.160 zone will decide reversal vs continuation.
Price reaction here will determine whether the market forms:
A macro bottom, or
A deeper bear market expansion.
Traders should wait for clear price action confirmation before taking large positions.
#RAYUSDT #RAY #Raydium #CryptoAnalysis #TechnicalAnalysis #Altcoins #SupportResistance #Wyckoff #CryptoTrading #Downtrend #Accumulation #MarketStructure #AltcoinSeason #CryptoChart

✅ Get Free Signals! Join Our Telegram Channel Here: t.me/TheCryptoNuclear
✅ Twitter: twitter.com/crypto_nuclear
✅ Join Bybit : partner.bybit.com/b/nuclearvip
✅ Benefits : Lifetime Trading Fee Discount -50%
✅ Twitter: twitter.com/crypto_nuclear
✅ Join Bybit : partner.bybit.com/b/nuclearvip
✅ Benefits : Lifetime Trading Fee Discount -50%
Clause de non-responsabilité
Les informations et publications ne sont pas destinées à être, et ne constituent pas, des conseils ou recommandations financiers, d'investissement, de trading ou autres fournis ou approuvés par TradingView. Pour en savoir plus, consultez les Conditions d'utilisation.
✅ Get Free Signals! Join Our Telegram Channel Here: t.me/TheCryptoNuclear
✅ Twitter: twitter.com/crypto_nuclear
✅ Join Bybit : partner.bybit.com/b/nuclearvip
✅ Benefits : Lifetime Trading Fee Discount -50%
✅ Twitter: twitter.com/crypto_nuclear
✅ Join Bybit : partner.bybit.com/b/nuclearvip
✅ Benefits : Lifetime Trading Fee Discount -50%
Clause de non-responsabilité
Les informations et publications ne sont pas destinées à être, et ne constituent pas, des conseils ou recommandations financiers, d'investissement, de trading ou autres fournis ou approuvés par TradingView. Pour en savoir plus, consultez les Conditions d'utilisation.