
The chart is self-explanatory and is shared for educational purposes.
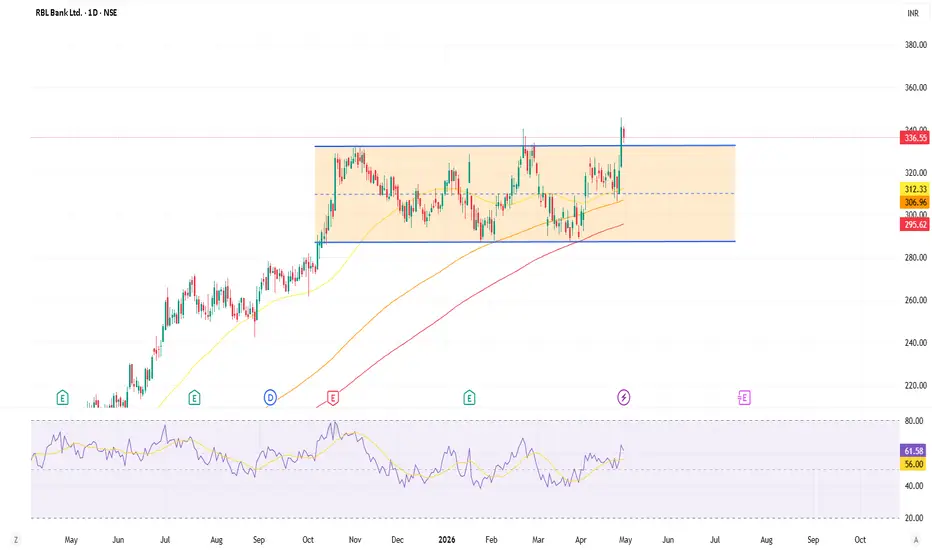
RBLBANK has recently delivered a strong breakout from a long-term consolidation range (rectangle pattern). The stock is consistently trading above its key moving averages, with the 50, 150, and 200-period lines showing a positive slope.
Following the breakout above the resistance zone, the price action suggests that previous resistance is now acting as a floor. With the RSI maintaining positive momentum, the upward trend appears likely to continue as long as it holds above the breakout level.
RBLBANK has recently delivered a strong breakout from a long-term consolidation range (rectangle pattern). The stock is consistently trading above its key moving averages, with the 50, 150, and 200-period lines showing a positive slope.
Following the breakout above the resistance zone, the price action suggests that previous resistance is now acting as a floor. With the RSI maintaining positive momentum, the upward trend appears likely to continue as long as it holds above the breakout level.

Clause de non-responsabilité
Les informations et publications ne sont pas destinées à être, et ne constituent pas, des conseils ou recommandations financiers, d'investissement, de trading ou autres fournis ou approuvés par TradingView. Pour en savoir plus, consultez les Conditions d'utilisation.
Clause de non-responsabilité
Les informations et publications ne sont pas destinées à être, et ne constituent pas, des conseils ou recommandations financiers, d'investissement, de trading ou autres fournis ou approuvés par TradingView. Pour en savoir plus, consultez les Conditions d'utilisation.