RBS – Bearish break likely
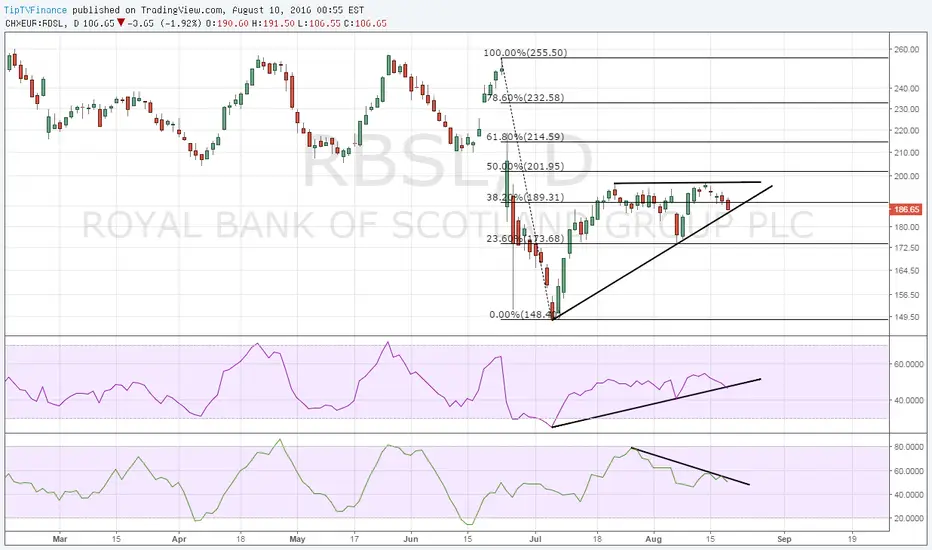
Daily chart pattern – Rising trend line is being put to test
Daily RSI breaching the rising trend line
Daily money flow index diverged from price chart
Overall, prices appear on track to breach rising trend line support on day end closing basis.
Such a move would add credence to failure to sustain above 38.2% Fibo level of 189.31 and bearish money flow divergence and thus would open doors for 173.68 (23.6% Fibo level).
On the higher side, we need a convincing break above 196.60 (July 21 high) to signal bearish invalidation.
Daily RSI breaching the rising trend line
Daily money flow index diverged from price chart
Overall, prices appear on track to breach rising trend line support on day end closing basis.
Such a move would add credence to failure to sustain above 38.2% Fibo level of 189.31 and bearish money flow divergence and thus would open doors for 173.68 (23.6% Fibo level).
On the higher side, we need a convincing break above 196.60 (July 21 high) to signal bearish invalidation.

Publications connexes
Clause de non-responsabilité
Les informations et publications ne sont pas destinées à être, et ne constituent pas, des conseils ou recommandations financiers, d'investissement, de trading ou autres fournis ou approuvés par TradingView. Pour en savoir plus, consultez les Conditions d'utilisation.
Publications connexes
Clause de non-responsabilité
Les informations et publications ne sont pas destinées à être, et ne constituent pas, des conseils ou recommandations financiers, d'investissement, de trading ou autres fournis ou approuvés par TradingView. Pour en savoir plus, consultez les Conditions d'utilisation.