RBS – Poised for bearish break
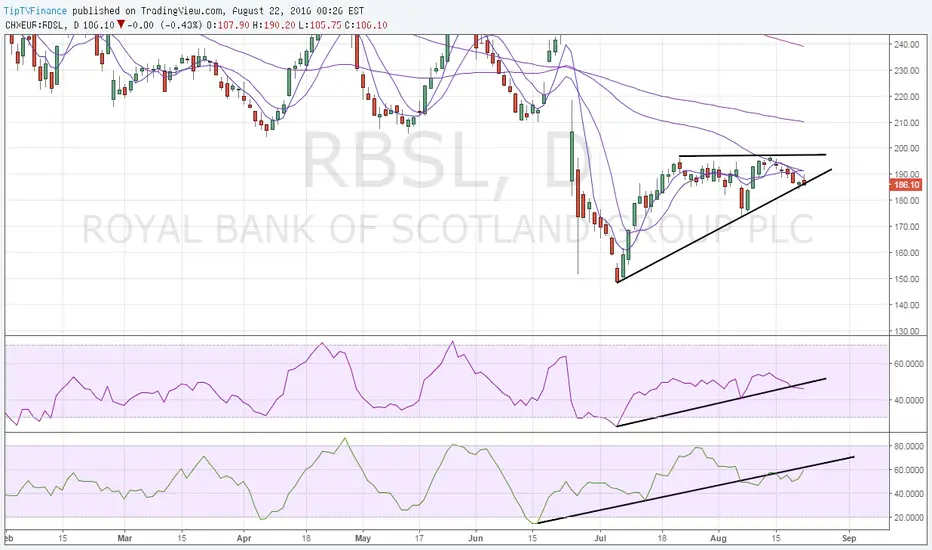
Daily chart pattern – Bearish breakout from rising wedge
Failure to hold above 50-DMA if followed by bearish break from rising wedge on day end closing basis coupled with daily RSI breaching rising trend line and falling money flow index would signal a sell-off to 173.80 (Aug 5 low).
On the higher side, only day end close above 50-DMA would signal bearish invalidation.
Failure to hold above 50-DMA if followed by bearish break from rising wedge on day end closing basis coupled with daily RSI breaching rising trend line and falling money flow index would signal a sell-off to 173.80 (Aug 5 low).
On the higher side, only day end close above 50-DMA would signal bearish invalidation.

Publications connexes
Clause de non-responsabilité
Les informations et publications ne sont pas destinées à être, et ne constituent pas, des conseils ou recommandations financiers, d'investissement, de trading ou autres fournis ou approuvés par TradingView. Pour en savoir plus, consultez les Conditions d'utilisation.
Publications connexes
Clause de non-responsabilité
Les informations et publications ne sont pas destinées à être, et ne constituent pas, des conseils ou recommandations financiers, d'investissement, de trading ou autres fournis ou approuvés par TradingView. Pour en savoir plus, consultez les Conditions d'utilisation.