Long
REN Ready For A 130% Run?
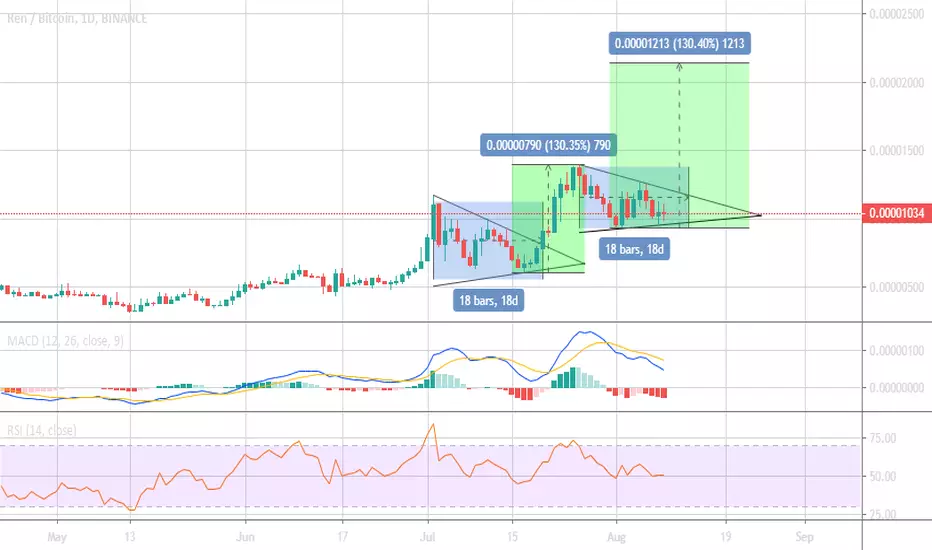
As you can see there are two very similar symmetrical triangles on this chart. Price action and length of the triangles are similar. Price could once again breakout on the 18th day of consolidation 8/13/19. Last time this setup occurred, we saw a 130% increase in price. If this happens again, we could see a price of 2150 sats.
Let's see if history repeats itself. I know we wouldn't be mad if it did.
Set stop losses just in case this breaks down.
*THIS IS NOT FINANCIAL ADVICE. I AM NOT RESPONSIBLE FOR ANY LOSSES OF MONEY*
Let's see if history repeats itself. I know we wouldn't be mad if it did.
Set stop losses just in case this breaks down.
*THIS IS NOT FINANCIAL ADVICE. I AM NOT RESPONSIBLE FOR ANY LOSSES OF MONEY*
Transaction en cours
Price has broken below support, BUT price has rebounded back into the triangle. Trade is still active.
Clause de non-responsabilité
Les informations et publications ne sont pas destinées à être, et ne constituent pas, des conseils ou recommandations financiers, d'investissement, de trading ou autres fournis ou approuvés par TradingView. Pour en savoir plus, consultez les Conditions d'utilisation.
Clause de non-responsabilité
Les informations et publications ne sont pas destinées à être, et ne constituent pas, des conseils ou recommandations financiers, d'investissement, de trading ou autres fournis ou approuvés par TradingView. Pour en savoir plus, consultez les Conditions d'utilisation.