
Experimental analysis with the intention to follow back later on as I am still learning
I thought I'd share this as it seems interesting, given its low probability.
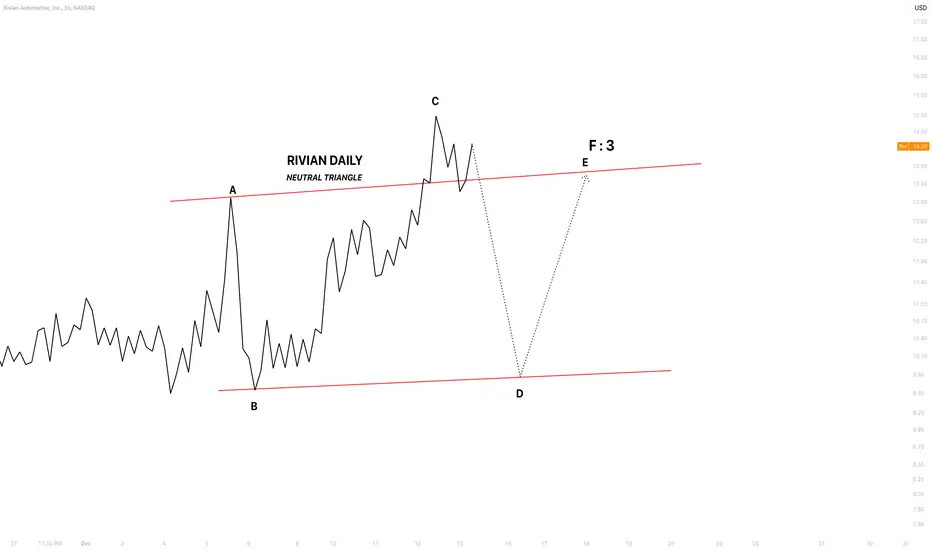
The lines represent a projected path and do not represent time
The pattern forms a neutral triangle.
Wave C is the largest, potentially 138% to 161.8% of wave A.
In this scenario, wave C concludes at 138%, provided my calculations are correct.
Any movement above wave C would invalidate this pattern.
I anticipate a significant sell-off to begin shortly for this to be accurate.
Let's see how this goes
I thought I'd share this as it seems interesting, given its low probability.
The lines represent a projected path and do not represent time
The pattern forms a neutral triangle.
Wave C is the largest, potentially 138% to 161.8% of wave A.
In this scenario, wave C concludes at 138%, provided my calculations are correct.
Any movement above wave C would invalidate this pattern.
I anticipate a significant sell-off to begin shortly for this to be accurate.
Let's see how this goes
Note
It appears that the rally has concluded and wave C has come to an end.
Clause de non-responsabilité
Les informations et publications ne sont pas destinées à être, et ne constituent pas, des conseils ou recommandations financiers, d'investissement, de trading ou autres fournis ou approuvés par TradingView. Pour en savoir plus, consultez les Conditions d'utilisation.
Clause de non-responsabilité
Les informations et publications ne sont pas destinées à être, et ne constituent pas, des conseils ou recommandations financiers, d'investissement, de trading ou autres fournis ou approuvés par TradingView. Pour en savoir plus, consultez les Conditions d'utilisation.