
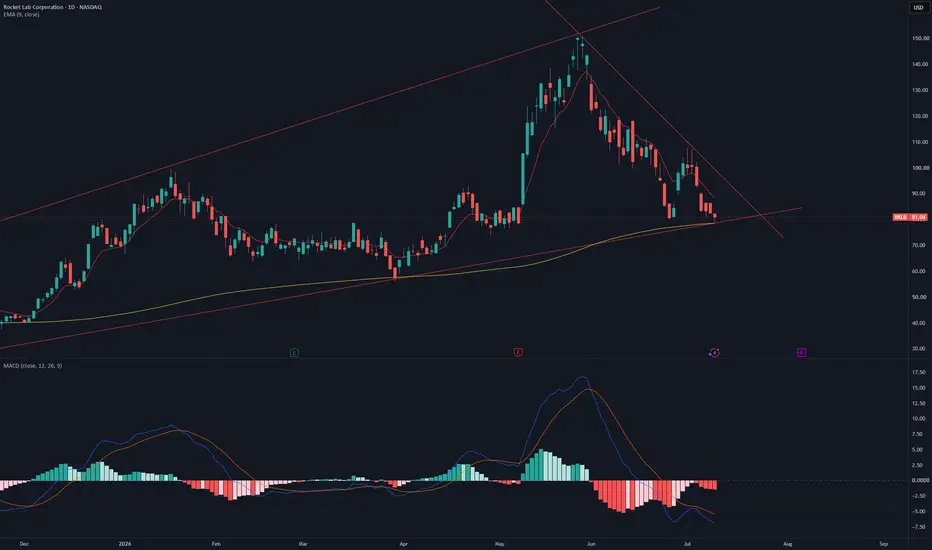
Rocket Lab has reached a fascinating technical inflection point.
After a powerful rally that nearly doubled the stock price in a short period, the market entered a healthy correction. Rather than chasing price, I've mapped out the bigger picture to identify where the next significant move could originate.
📈 The Bigger Picture
The ascending trendline (green support) has acted as the backbone of the longer-term uptrend, consistently producing higher lows over the past several months.
Despite the recent sell-off, that structure **remains intact**.
The correction has also created a series of **lower highs**, which are captured by the descending red trendline. This defines the current short-term bearish trend.
A Compression Pattern Is Emerging
Price is now trading between:
* Rising long-term support
* Falling short-term resistance
This creates a **symmetrical triangle**, where volatility compresses as buyers and sellers battle for control.
Historically, these patterns often precede a significant directional move—but they **do not predict the direction**. Confirmation is far more important than anticipation.
📊 Momentum
The MACD tells an equally interesting story.
Although momentum turned negative following the rally, the histogram is beginning to contract, suggesting bearish momentum is fading. This doesn't confirm a reversal, but it indicates that selling pressure is becoming less aggressive.
Levels I'm Watching
Bullish Case
* Price continues respecting ascending support.
* Breaks above the descending trendline with convincing volume.
* This would signal buyers are regaining control and could open the door to another attempt at higher highs.
Bearish Case
* Price loses the long-term ascending support.
* That would invalidate the current bullish structure and suggest the correction may have further to run before finding stronger demand.
My Take
I don't see this as a chart that requires predicting the next move. Instead, I see a chart approaching a *decision point*.
The longer-term trend is still constructive, while the shorter-term trend remains bearish. Eventually one of those trends will win.
For now, patience is the edge.
The next confirmed breakout—or breakdown—will likely determine Rocket Lab's next major move.
*This is my personal technical analysis based solely on price action and chart structure. It is not financial advice. Always do your own research before making investment decisions.*
After a powerful rally that nearly doubled the stock price in a short period, the market entered a healthy correction. Rather than chasing price, I've mapped out the bigger picture to identify where the next significant move could originate.
📈 The Bigger Picture
The ascending trendline (green support) has acted as the backbone of the longer-term uptrend, consistently producing higher lows over the past several months.
Despite the recent sell-off, that structure **remains intact**.
The correction has also created a series of **lower highs**, which are captured by the descending red trendline. This defines the current short-term bearish trend.
A Compression Pattern Is Emerging
Price is now trading between:
* Rising long-term support
* Falling short-term resistance
This creates a **symmetrical triangle**, where volatility compresses as buyers and sellers battle for control.
Historically, these patterns often precede a significant directional move—but they **do not predict the direction**. Confirmation is far more important than anticipation.
📊 Momentum
The MACD tells an equally interesting story.
Although momentum turned negative following the rally, the histogram is beginning to contract, suggesting bearish momentum is fading. This doesn't confirm a reversal, but it indicates that selling pressure is becoming less aggressive.
Levels I'm Watching
Bullish Case
* Price continues respecting ascending support.
* Breaks above the descending trendline with convincing volume.
* This would signal buyers are regaining control and could open the door to another attempt at higher highs.
Bearish Case
* Price loses the long-term ascending support.
* That would invalidate the current bullish structure and suggest the correction may have further to run before finding stronger demand.
My Take
I don't see this as a chart that requires predicting the next move. Instead, I see a chart approaching a *decision point*.
The longer-term trend is still constructive, while the shorter-term trend remains bearish. Eventually one of those trends will win.
For now, patience is the edge.
The next confirmed breakout—or breakdown—will likely determine Rocket Lab's next major move.
*This is my personal technical analysis based solely on price action and chart structure. It is not financial advice. Always do your own research before making investment decisions.*

Clause de non-responsabilité
Les informations et publications ne sont pas destinées à être, et ne constituent pas, des conseils ou recommandations financiers, d'investissement, de trading ou autres fournis ou approuvés par TradingView. Pour en savoir plus, consultez les Conditions d'utilisation.
Clause de non-responsabilité
Les informations et publications ne sont pas destinées à être, et ne constituent pas, des conseils ou recommandations financiers, d'investissement, de trading ou autres fournis ou approuvés par TradingView. Pour en savoir plus, consultez les Conditions d'utilisation.