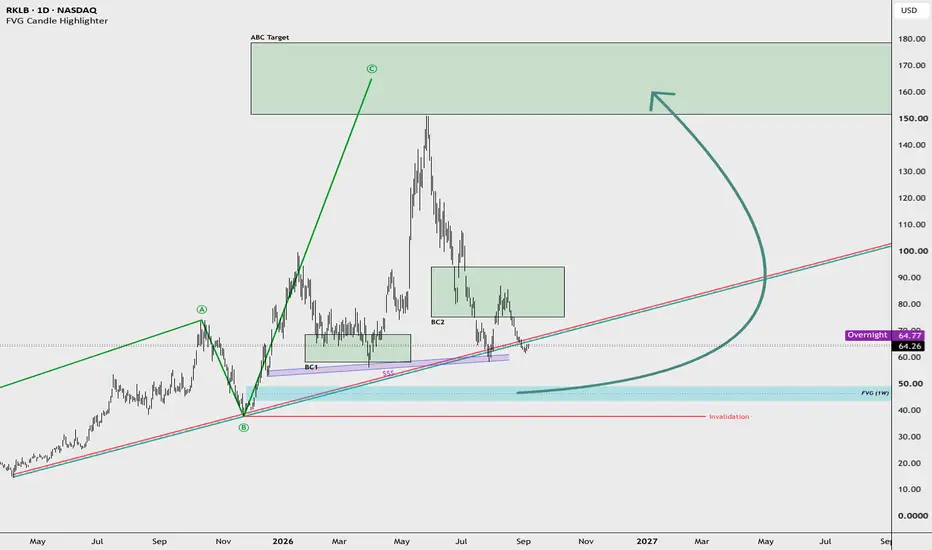
Rocket Lab ( RKLB) continues to progress within its primary high-timeframe sequence on the daily chart, anchored between the Point A peak ($74.00) and the Point B structural low near $38.00. The prior impulse to the $152.00 cycle peak validated the broader bullish market structure, locking in the long-term Point C target zone between $153.00 and $180.00. Despite the sharp corrective distribution off the highs, the structural integrity of this macro roadmap remains active as long as the primary base holds.
Following the breakdown from the BC2 consolidation, price has compressed along the ascending diagonal, leaving engineered sell-side liquidity ($$$) resting untouched beneath the blue channel. An unmitigated weekly Fair Value Gap (cyan zone, $44.00–$50.00) sits directly underneath this trendline pool. From an order-flow perspective, price has high probability of executing a clean liquidity run into this imbalance, tapping deep discount pricing and engineering the institutional volume needed to facilitate a durable reversal.
The optimal game plan is to wait for the liquidity flush into the $44.00–$50.00 FVG, looking for low-timeframe absorption and bullish shifts before initiating long exposure. The structural invalidation level is clearly defined by the red horizontal line at $38.00 (just beneath Point B); a breach below this line invalidates the active sequence. So long as this invalidation line remains protected, the setup provides an asymmetric risk-to-reward profile targeting the $153.00–$180.00 Point C box.
RKLB) continues to progress within its primary high-timeframe sequence on the daily chart, anchored between the Point A peak ($74.00) and the Point B structural low near $38.00. The prior impulse to the $152.00 cycle peak validated the broader bullish market structure, locking in the long-term Point C target zone between $153.00 and $180.00. Despite the sharp corrective distribution off the highs, the structural integrity of this macro roadmap remains active as long as the primary base holds.Following the breakdown from the BC2 consolidation, price has compressed along the ascending diagonal, leaving engineered sell-side liquidity ($$$) resting untouched beneath the blue channel. An unmitigated weekly Fair Value Gap (cyan zone, $44.00–$50.00) sits directly underneath this trendline pool. From an order-flow perspective, price has high probability of executing a clean liquidity run into this imbalance, tapping deep discount pricing and engineering the institutional volume needed to facilitate a durable reversal.
The optimal game plan is to wait for the liquidity flush into the $44.00–$50.00 FVG, looking for low-timeframe absorption and bullish shifts before initiating long exposure. The structural invalidation level is clearly defined by the red horizontal line at $38.00 (just beneath Point B); a breach below this line invalidates the active sequence. So long as this invalidation line remains protected, the setup provides an asymmetric risk-to-reward profile targeting the $153.00–$180.00 Point C box.

Clause de non-responsabilité
Les informations et publications ne sont pas destinées à être, et ne constituent pas, des conseils ou recommandations financiers, d'investissement, de trading ou autres fournis ou approuvés par TradingView. Pour en savoir plus, consultez les Conditions d'utilisation.
Clause de non-responsabilité
Les informations et publications ne sont pas destinées à être, et ne constituent pas, des conseils ou recommandations financiers, d'investissement, de trading ou autres fournis ou approuvés par TradingView. Pour en savoir plus, consultez les Conditions d'utilisation.